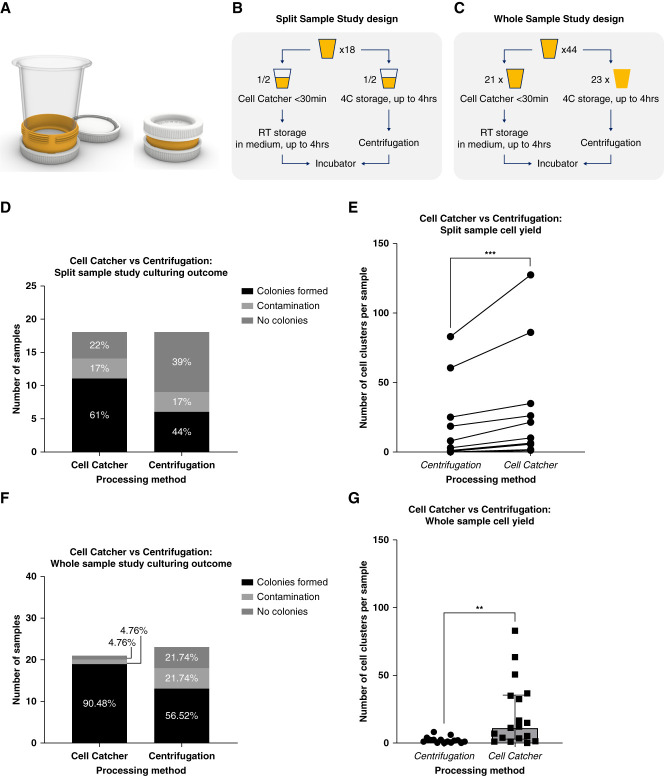
Figure 1.
Cell Catcher clinical validation study. (A) Cell Catcher diagram. The hub of the Cell Catcher has detachable lids and houses a membrane. It connects to a detachable funnel for urine samples to be processed by gravity. After filtration, media are added for the cells to be preserved during transport, inside the hub. Prototypes were produced using Polyjet 3D printing (University College London, B-made 3D printing, Bartlett School of Architecture). (B) Split-sample study design. Eighteen samples were collected from patients with renal tubulopathies; each sample was split into two equal parts—Cell Catcher group and centrifugation group. Sample fractions in the Cell Catcher group were processed on site within 30 minutes of collection and stored at room temperature for up to 4 hours during transportation to the laboratory, where they were plated. Sample fractions in the centrifugation group were stored at 4°C and transported to the laboratory on ice within 4 hours to be centrifuged and plated. (C) Whole-sample study design. Forty-four samples were collected from patients with renal tubulopathies, BBS, and healthy adults, and whole volume was processed either by Cell Catcher or centrifugation. (D) Culturing outcomes, split-sample study. Cells from sample fractions processed by either a Cell Catcher or centrifugation were seeded, cultured, and assigned to the following categories: no clusters (by 2 weeks), clusters (day 6), and contamination (within the first day). Distribution of the three culturing outcomes for each experimental condition is shown. (E) Split-sample cell yield differences between Cell Catcher and centrifugation fractions. Cell clusters (>10 cells) were quantified on day 6 after plating, by two researchers independently. Average numbers of the two counts are plotted for each of the 11 samples in the paired study, where clusters formed in at least one of the fractions (Wilcoxon nonparametric paired t test, n=11, P = 0.001). (F) Culturing outcomes, whole-sample study. Cells from samples processed by either the Cell Catcher or centrifugation were seeded, cultured, and assigned to the following categories: no clusters (by 2 weeks), clusters (day 6), and contamination (within the first day). Distribution of the three culturing outcomes for each experimental condition is shown. (G) Whole-sample cell yield differences between Cell Catcher and centrifugation-processed samples. Cluster counts in samples processed by either Cell Catcher (n=18) or centrifugation (n=16), after two outliers that were identified in each group were removed. Mann–Whitney test, P = 0.0013. Median+interquartile range is plotted. BBS, Bardet–Biedl syndrome.

