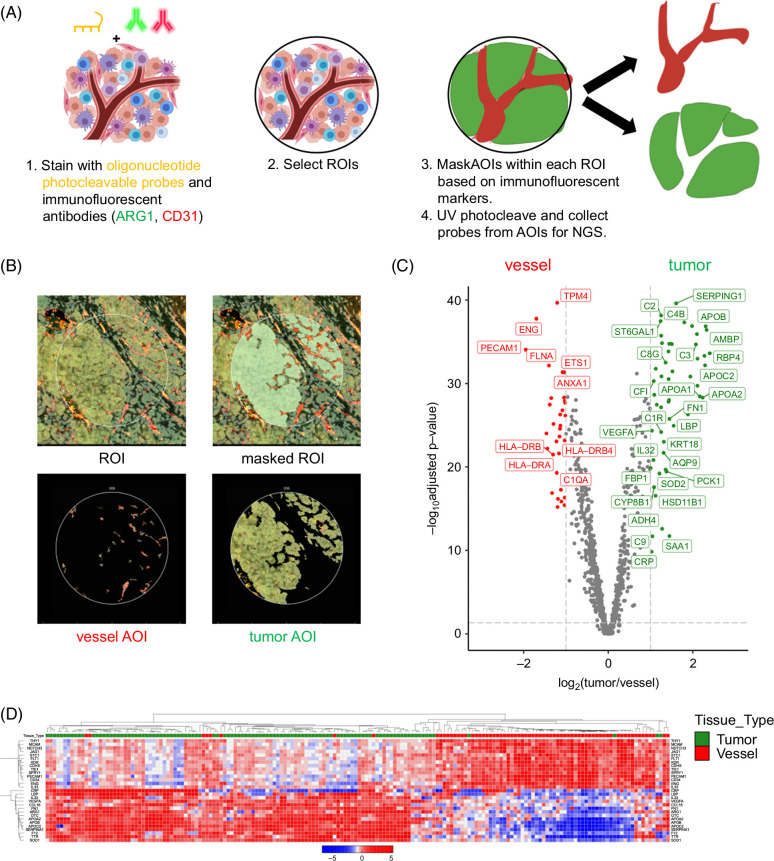
FIGURE 1.
GeoMx spatial profiling precisely separates vessels from tumor regions for gene expression profiling. (A) Workflow of sequential tissue staining with photocleavable oligonucleotide probes followed by staining with immunofluorescent tissue subcompartment labels. (B) Example of 1 HCC tumor “region of interest” (ROI), masked ROI to identify CD31-positive (red) and Arg1-positive (green) “areas of interest” (AOIs). (C) Volcano plot of genes differentially expressed across all ROIs and AOIs (false discovery rate–adjusted p value ≥0.05, log2(fold change) ≥1), with genes colored in green for tumor AOIs and red for vessel AOIs. (D) Hierarchically clustered heatmap of all tumor (green column label) and vessel (red column label) AOIs.

