FIGURE 3.
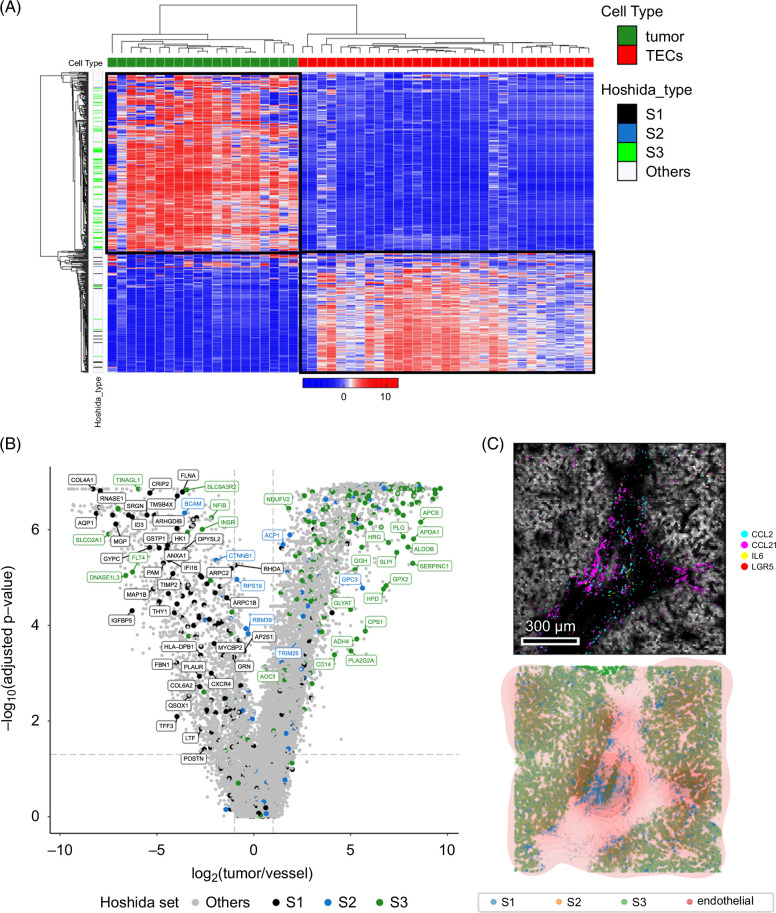
Single-cell dissociative and in situ gene expression profiling directly confirms endothelial expression of most “S1” HCC tumor genes. (A) Unsupervised hierarchical clustering of quasi-bulk cancer cells and TECs from the scAtlasLC data set confirm S1 genes are more highly expressed in TECs and S3 genes are in cancer cells. (B) Volcano plot showing differentially expressed genes between quasi-bulk cancer cells and TECs with genes colored by Hoshida gene set membership (S1 black, S2 blue, and S3 green) and labeled if their fold changes exceed 2 and meet FDR-adjusted p value threshold. (C) Molecular Cartography direct transcript visualization demonstrates colocalization of S3 genes (green) with cancer cells and S1 genes (blue) with endothelial gene density (red). Abbreviations: FDR, false discovery rate; TEC, tumor-associated endothelial cell.

