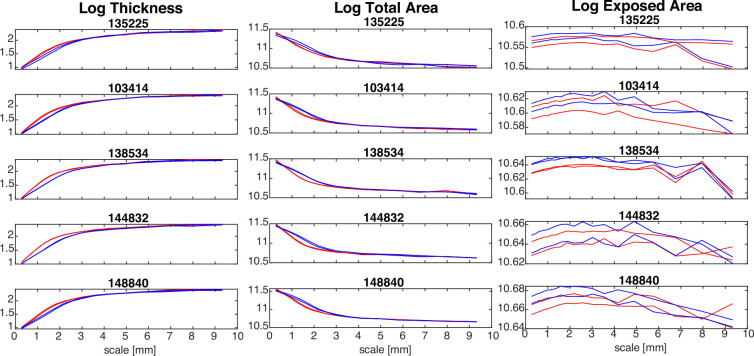
Appendix 2—figure 1. Effect of using different original image resolutions in five examples Human Connectome Project (HCP) subjects.
In all plots, red lines indicate an original image resolution of 0.7 mm isotropic, whereas blue line indicate an original image resolution of 1 mm isotropic. Both hemispheres are shown for each subject.

