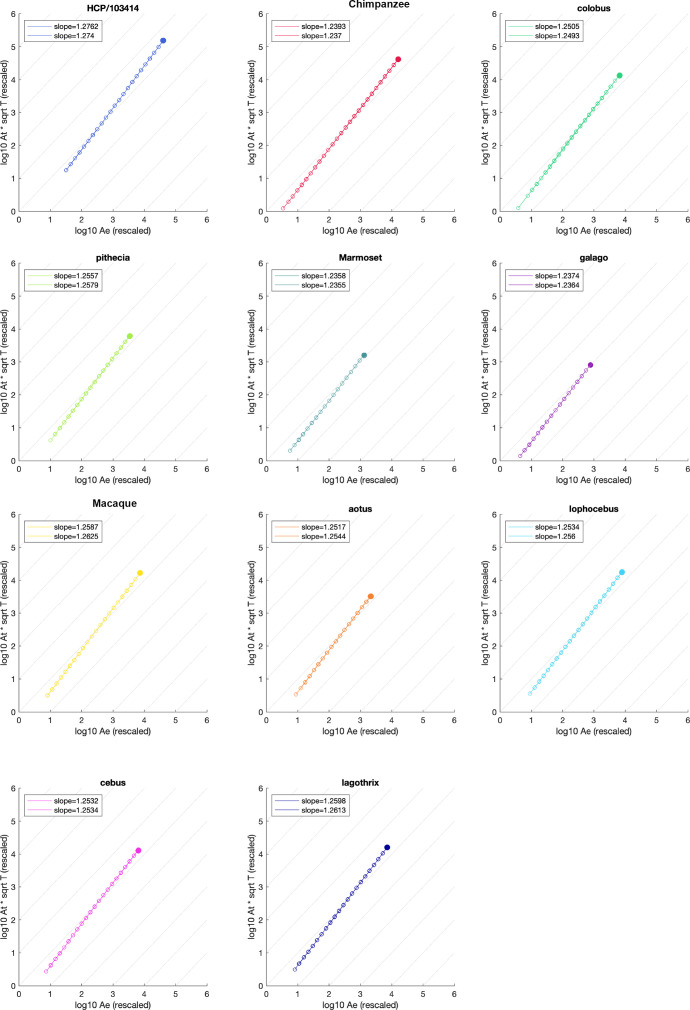
Appendix 3—figure 2. Detailed scaling plots for each species.
Filled circle is the original mesh, empty circle are data points from the coarse-graining algorithm. Empty circles are connected by a line for visualisation. Two hemispheres are analysed and separated for each species, although data points overlap substantially in plot. Slope estimates are given at top left corner in each plot.

