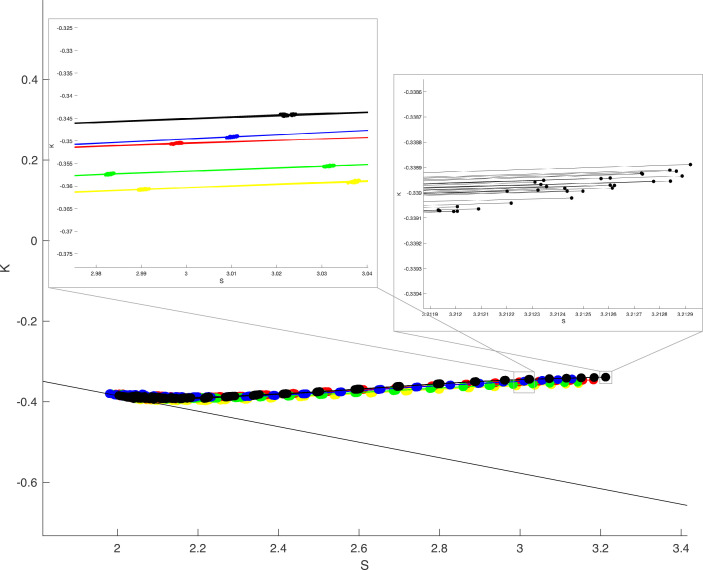
Appendix 6—figure 1. Randomising grid for coarse-graining yields very consistent results within individuals in space.
Thick black line indicates and a gyrification index . Each colour in the plot indicates a different human individual (Human Connectome Project, HCP 103414 - yellow, 135225 - red, 138534 - green, 144832 - blue, 148840 - black, respectively). 30 jittered grid outputs are shown for each individual, lines connect datapoints of the same jittered version. Zoomed in panels show that the jittered outputs have far less variation within than between individuals.

