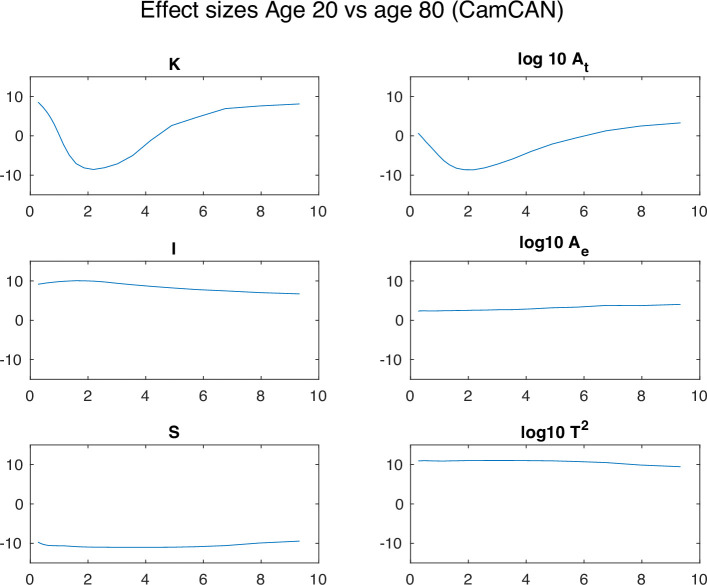
Appendix 7—figure 2. Effect size between the 20 y.o. and 80 y.o. cohort in all morphological variables.
Each panel shows a morphological metric, and data is shown for a group of 20-year-olds (red, n=27) and a group of 80-year-olds (blue, n=86). Effect size is measured as the rank sum z statistic between the two groups.

