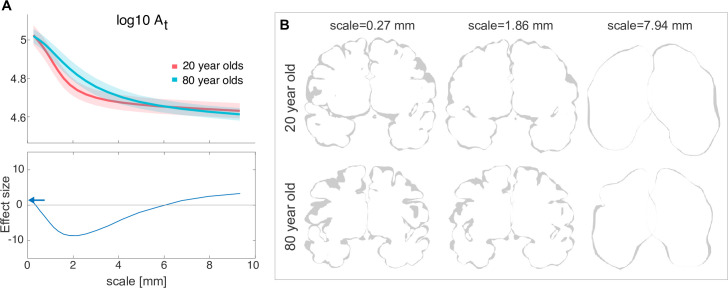
Figure 4. Human ageing shows differential effects depending on spatial scale.
(A) Top: is shown for a group of 20-year-olds (red, n=27) and a group of 80-year-olds (blue, n=86). Mean and standard deviation are shown as the solid line and the shaded area, respectively. Bottom: Effect size (measured as rank sum z-values) between the older and younger groups at each scale. Positive effect indicates a larger value for the younger group. Blue arrows indicate the effect size at the ‘native scale’ i.e., using the original free surfer grey and white matter meshes. (B) Coronal slices of the pial surface of an example 20-year-old subject and an 80-year-old subject at different scales (columns).

