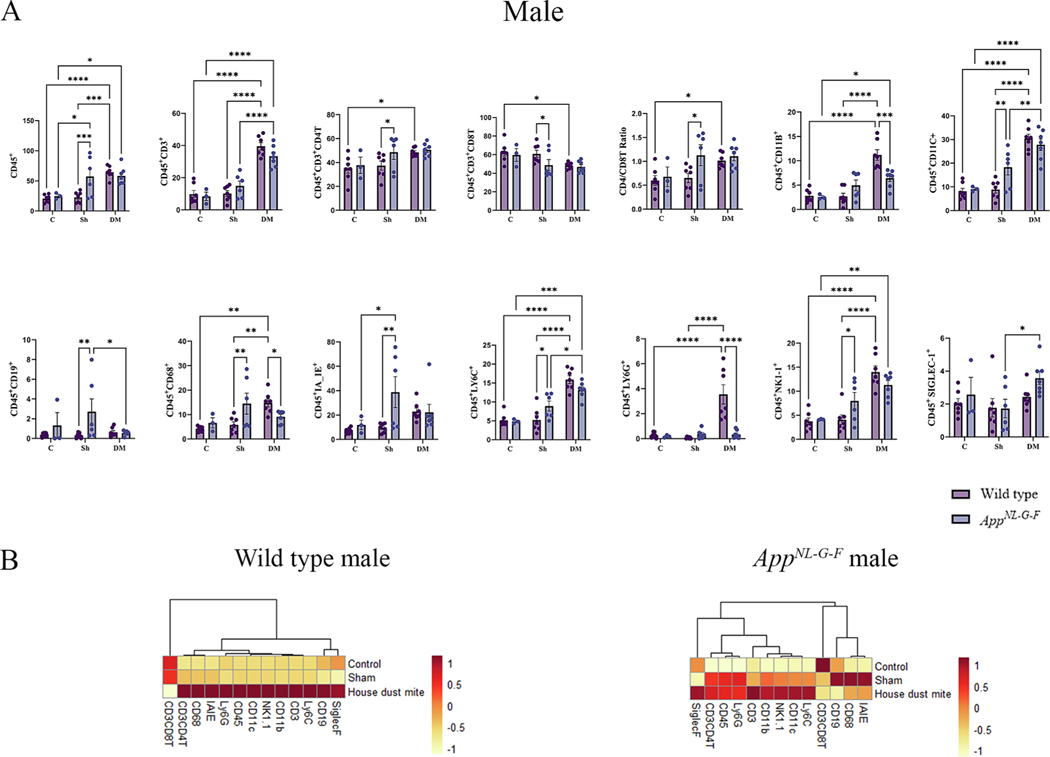
Fig. 1.
House dust mite exposure selectively upregulated specific immune subsets in wild type (WT) and AppNL-G-F male mice. BALF of male WT and AppNL-G-F mice from 16-week exposed control, sham, and HDM exposed (833 μg/kg, 30 min/day, 3 days/week) groups were collected, for flow cytometric analysis for markers of adaptive and innate immune cell phenotypes. (A) Each dot represents data for a single mouse, and bars indicate mean values of % cells (n = 3–9 mice per group) gated through live cells. Results are depicted as mean ± SEM; *p < 0.05, **p < 0.01, ***p < 0.001, and ****p < 0.0001. (B) Column scaled heatmap colors represent the percentage of cells in each subset gated through live cells from a relatively lower percent (in yellow) to a higher percent (in red). Dendrograms indicate the clustering relationships among the groups and % of cell populations, shown above the heatmap. Two-way ANOVAs with interaction between C/Sh/DM (followed by multiple comparisons) and WT/AppNL-G-F produced following statistics; CD45: C/Sh/DM, F2, 31 = 15.62 and p < 0.0001, WT/AppNL-G-F, F1,31 = 3.740 and p = 0.0623, interaction, F2, 31 = 5.638 and p = 0.0082; CD3: C/Sh/DM, F2, 31 = 72.86 and p < 0.0001, WT/AppNL-G-F, F1, 31 = 0.2009 and p = 0.6571, interaction, F2, 31 = 2.705 and p = 0.0827; CD4: C/Sh/DM, F2, 31 = 4.950 and p = 0.0136, WT/AppNL-G-F, F1, 31 = 2.502 and p = 0.1239, interaction, F2, 31 = 0.8767 and p = 0.4262; CD8: C/Sh/DM, F2, 31 = 5.361 and p = 0.01, WT/AppNL-G-F, F1, 31 = 2.593 and p = 0.1174, interaction, F2, 31 = 1.142 and p = 0.3321; CD4/CD8: C/Sh/DM, F2, 31 = 4.780 and p = 0.0155, WT/AppNL-G-F, F1,31 = 3.977 and p = 0.0550, interaction, F2, 31 = 1.571 and p = 0.2239; CD11b: C/Sh/DM, F2, 31 = 29.54 and p < 0.0001, WT/AppNL-G-F, F1, 31 = 1.588 and p = 0.2171, interaction, F2, 31 = 9.847 and p = 0.0005; CD11c: C/Sh/DM, F2, 31 = 47.42 and p < 0.0001, WT/AppNL-G-F, F1, 31 = 1.968 and p = 0.1706, interaction, F2, 31 = 4.402 and p = 0.0208; CD19: C/Sh/DM, F2, 31 = 1.147 and p = 0.2485, WT/AppNL-G-F, F1, 31 = 4.802 and p = 0.0361, interaction, F2, 31 = 2.563 and p = 0.0933; CD68: C/Sh/DM, F2, 31 = 4.355 and p = 0.0215, WT/AppNL-G-F, F1, 31 = 1.046 and p = 0.3143, interaction, F2, 31 = 6.651 and p = 0.0039; IA_IE: C/Sh/DM, F2, 31 = 2.617 and p = 0.0891, WT/AppNL-G-F, F1, 31 = 4.371 and p = 0.0449, interaction, F2, 31 = 3.458 and p = 0.0441; LY6C: C/Sh/DM, F2, 31 = 45.27 and p < 0.0001, WT/AppNL-G-F, F1, 31 = 0.06460 and p = 0.8010, interaction, F2, 31 = 5.291 and p = 0.0105; LY6G: C/Sh/DM, F2, 31 = 14.65 and p < 0.0001, WT/AppNL-G-F, F1, 31 = 9.803 and p = 0.0038, interaction, F2, 31 = 13.80 and p < 0.0001; NK1–1: C/Sh/DM, F2, 31 = 29.31 and p < 0.0001, WT/AppNL-G-F, F1, 31 = 0.2934 and p = 0.5919, interaction, F2, 31 = 4.369 and p = 0.0213, and SIGLEC-1: C/Sh/DM, F2, 31 = 3.893 and p = 0.0310, WT/AppNL-G-F, F1, 31 = 1.828 and p = 0.1862, interaction, F2, 31 = 0.8715 and p = 0.4283.

