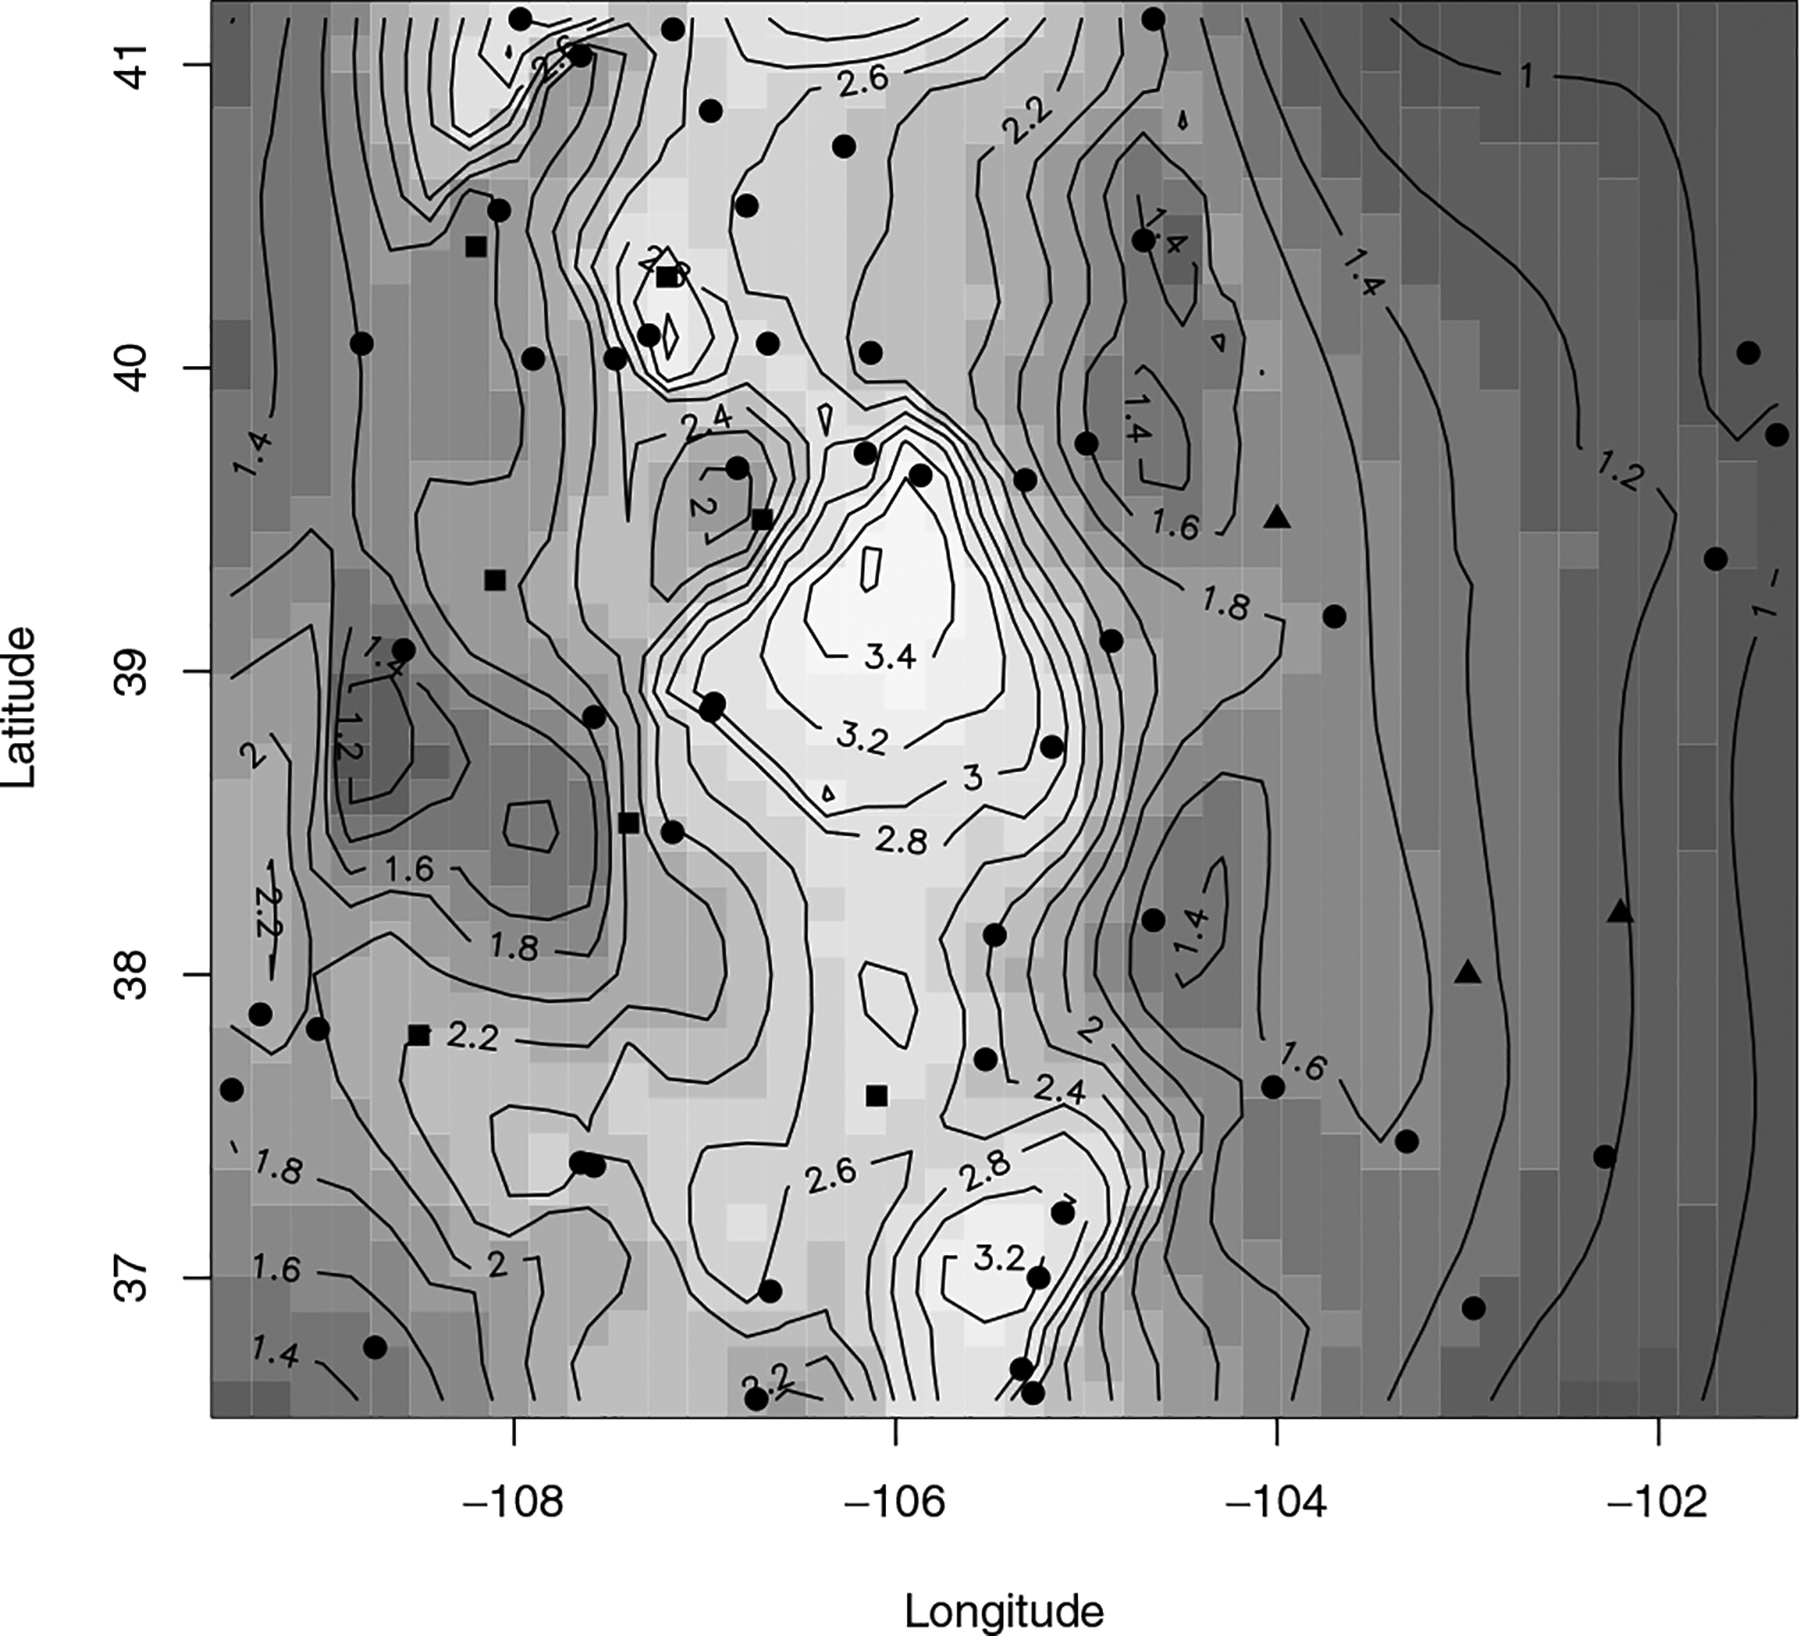
Figure 2.

An image plot of the spatial domain in Colorado, with elevation contours. The 50 sampling sites are indicated by the solid circles. Three solid triangles represent the three sensitive prediction locations while seven solid squares represent the remaining prediction locations seen in Figure 3.
