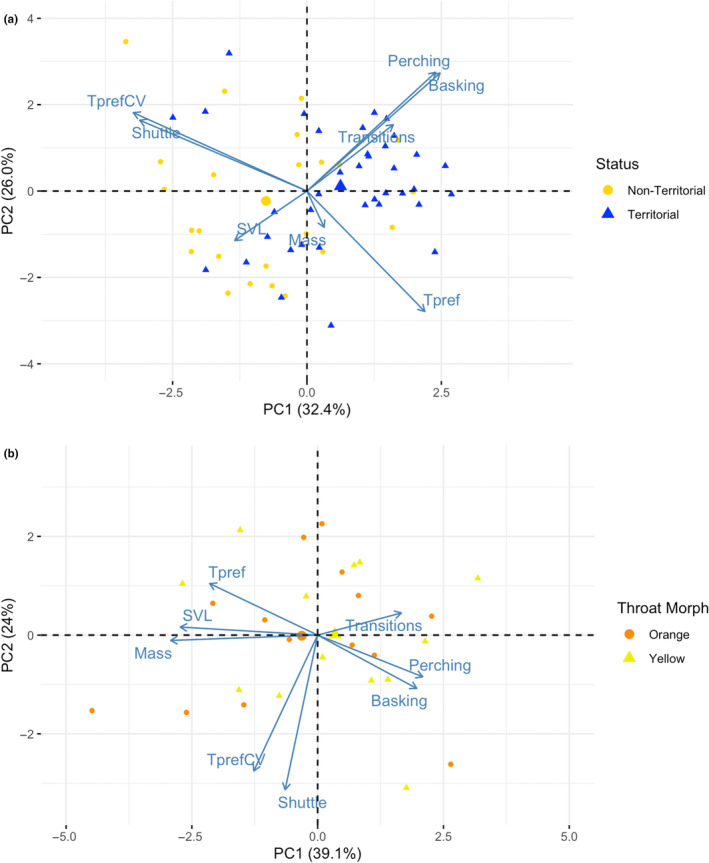
FIGURE 6.

(a) Patterns of covariation among behavioural and thermal traits and body size based on the first two axes from a principal component analysis in males. Territorial and non‐territorial males differed in PC space, specifically on PC1 (F 1,60 = 17.6, p < .001). The mean position of each status group is designated with a larger shape in the plot. (b) Patterns of covariation among behavioural and thermal traits and body size based on the first two axes from a principal component analysis in females. The mean position of each morph is designated with a larger shape in the plot. Orange and yellow females did not differ in PC space.
