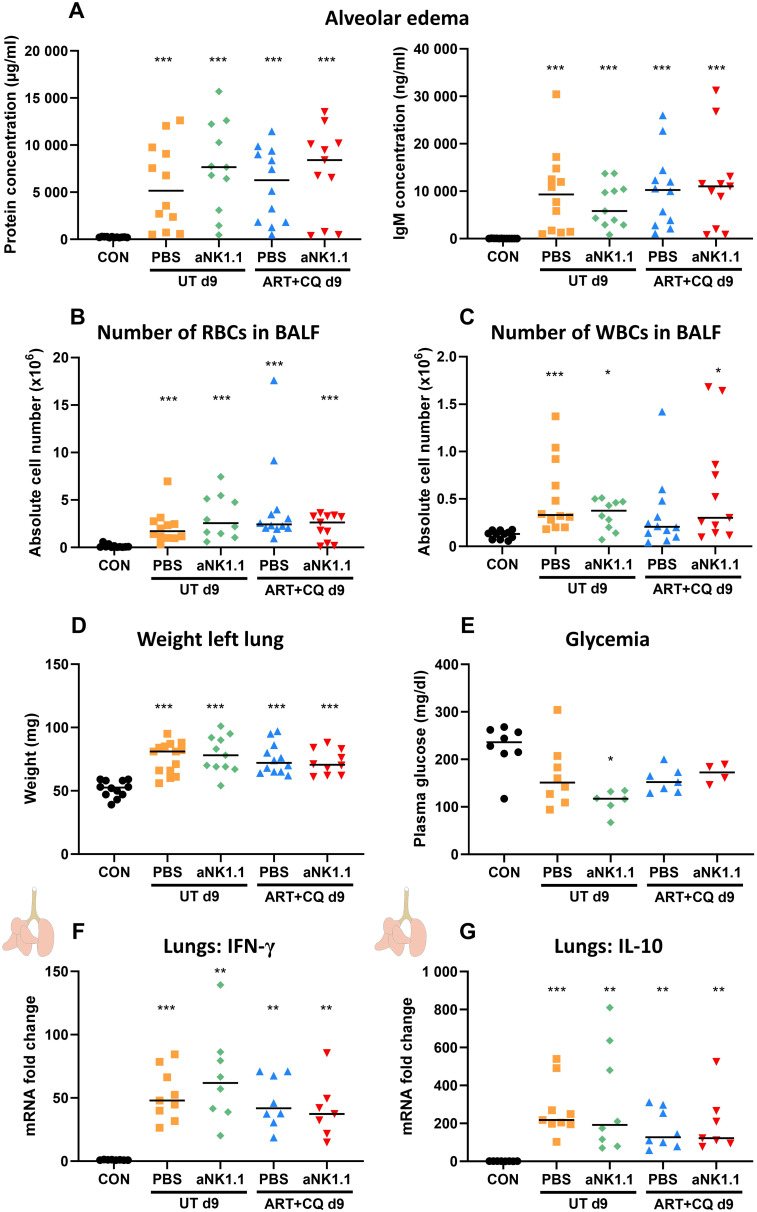
Figure 6.
Lung pathology was not affected by the absence of NK cells at 9 dpi. C57BL/6 mice were infected with PbNK65. Treatment at 8 dpi with 10 mg/kg artesunate + 30 mg/kg chloroquine (ART+CQ). At 6 dpi, mice were injected i.p. with 500 µg of anti-NK1.1 (PK136) depletion antibodies or PBS. Mice were dissected at 9 dpi. (A) Level of alveolar edema was determined based on protein concentration (A, left) and IgM concentration (A, right) in the BALF. (B, C) The number of RBCs (B) and WBCs (C) present in the BALF was counted using a Bürker chamber. (D) Unperfused left lungs were weighed as another marker for lung pathology. (E) Glucose levels in plasma were determined using OneTouch Verio glucometer. (A-E) Data from two (E) or three (A-D) experiments. Each symbol represents data of an individual mouse. n = 8-12 for CON, n = 8-14 for UT PBS, n = 6-11 for UT aNK1.1, n = 7-12 for ART+CQ PBS, n = 4-11 for ART+CQ aNK1.1. (F, G) The difference in the mRNA fold expression in left lungs homogenates at 9 dpi was determined compared to uninfected controls for (F) IFN-γ and (G) IL-10. Data from two experiments. Each symbol represents data of an individual mouse. n = 8 for CON, n = 9 for UT PBS, n = 8 for UT aNK1.1, n = 8 for ART+CQ PBS, n = 7 for ART+CQ aNK1.1. (A-G) The non-parametric Mann-Whitney U test followed by the Holm-Bonferroni correction was used to determine significance between all groups, except for the comparison untreated (UT) PBS with antimalarial drug-treated (ART+CQ) anti-NK1.1 and the comparison UT anti-NK1.1 with ART+CQ PBS. P-values were indicated as follows: *p<0.05, **p<0.01, ***p<0.001. Median in each group was indicated by a horizontal black line, unless indicated otherwise. Statistical differences compared to the uninfected control group are indicated with asterisk above the individual data sets and horizontal lines with asterisk on top indicate significant differences between groups.

