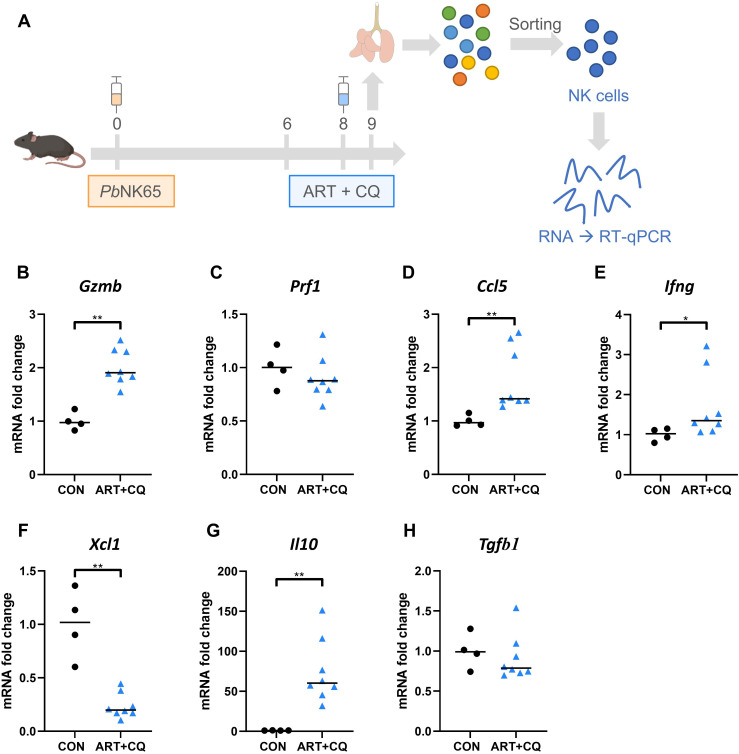
Figure 8.
NK cells drastically upregulate their expression of IL-10 in response to PbNK65 infection. C57BL/6 mice were infected with PbNK65. Mice were treated at 8 dpi with 10 mg/kg artesunate + 30 mg/kg chloroquine (ART+CQ). Mice were dissected at 9 dpi. Pulmonary cells were isolated according to protocol 2 and fluorescence activated cell sorting was performed to isolate NK cells (CD3- NK1.1+ DX5+). (A) Schematic representation of experiment set-up. The difference in the mRNA fold expression in the NK cells at 9 dpi was determined compared to uninfected controls for (B) Granzyme B (Gzmb), (C) Perforin (Prf1), (D) Ccl5, (E) Ifng, (F) Xcl1, (G) Il10 and (H) Tgfb1. Data from two experiments. Each symbol represents data of an individual mouse. n = 4 for CON, n = 8 for ART+CQ. The non-parametric Mann-Whitney U test followed by the Holm-Bonferroni correction was used to determine significance between all groups. P-values were indicated as follows: *p<0.05, **p<0.01. Median in each group was indicated by a horizontal black line, unless indicated otherwise. Statistical differences compared to the uninfected control group are indicated with asterisk above the individual data sets and horizontal lines with asterisk on top indicate significant differences between groups.

