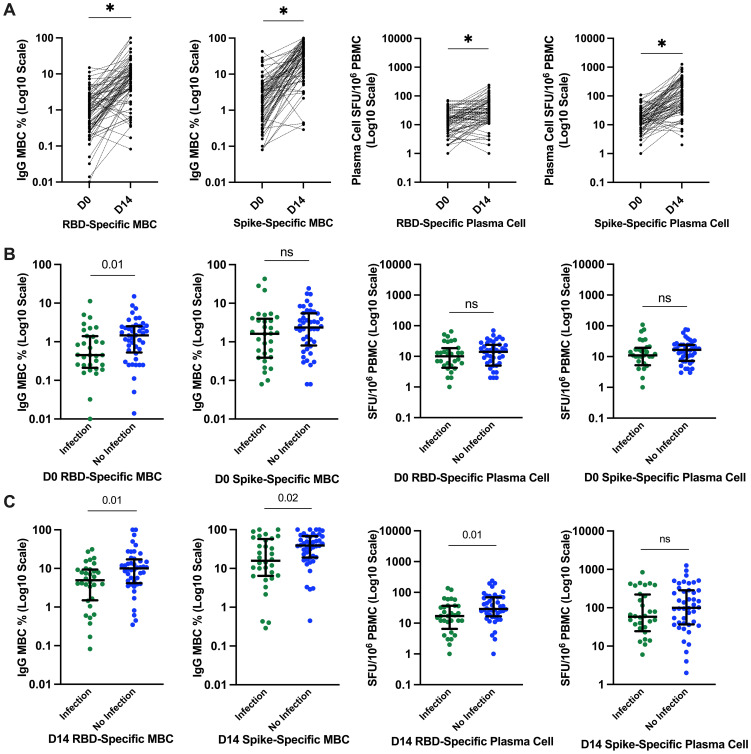
Figure 3.
SARs-CoV-2–specific B-cell responses and relationship with incident infection. (A) Significantly higher SARS-CoV-2–specific memory B-cell and plasma cell responses at day 14. *p ≤ 0.0001 compared to pre-vaccine response by Wilcoxon signed-rank test. (B) SARS-CoV-2–specific RBD and S plasma cell and memory B-cell responses before the third-dose SARS-CoV-2 vaccination and relationship with incident SARS-CoV-2 infection. Bars represent median and interquartile range. P-value calculated by Mann–Whitney U test are shown above each comparison. (C) SARS-CoV-2–specific RBD and S plasma cell and memory B-cell responses 14 days after the third-dose SARS-CoV-2 vaccination and relationship with incident SARS-CoV-2 infection. D0, day 0; D14, day 14; PBMCs, peripheral blood mononuclear cells; RBD, receptor-binding domain; S, spike; ns, not significant; SFU, spot-forming unit.

