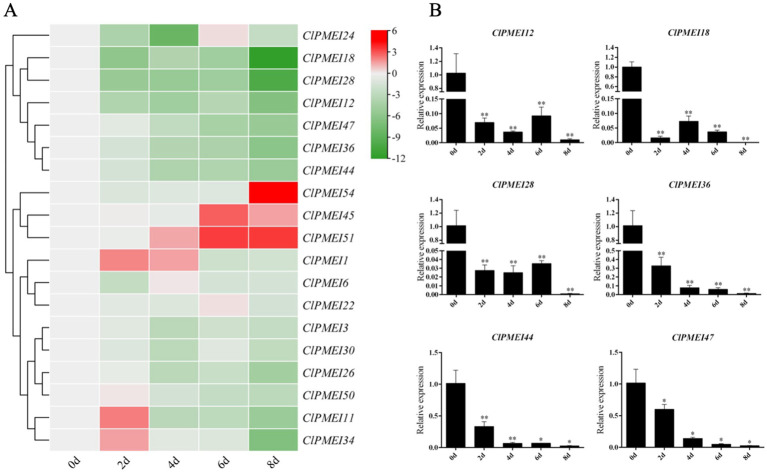
Figure 7.
Expression analysis of PMEI genes in watermelon under drought treatments. (A) Gene expression heatmap of PMEI genes. The bars of the heatmap represent expression values after log2 transformation and qRT-PCR expression values normalization. The color scale from green to red represents the lower to higher relative expression levels. (B) Relative expressions of ClPMEI12, 18, 28, 36, 44 and 47 under drought treatments. Column cluster analysis shows different groups based on the expression. Student’s t-test was used to determine significant differences at the same period between control group and treatment group. Significance level: * P<0.05. ** P<0.01.

