FIGURE 3.
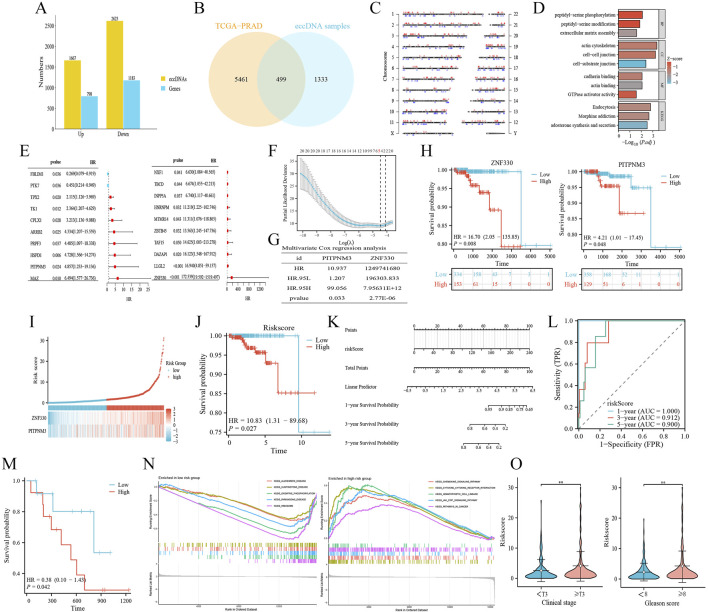
Construction of a novel PRAD risk prediction model based on differentially expressed genes amplified by eccDNA. (A) Number of differentially expressed eccDNAs and amplified coding genes obtained based on Circle-Seq results. (B) Differential eccDNA amplified coding genes and TCGA-PRAD differentially expressed genes were taken to intersect to obtain 499 eccDNA-associated differentially expressed genes (eDEGs). (C) Distribution of the 499 eDEGs on the chromosomes. Red, high expression; blue, low expression. (D) eDEGs were analyzed for functional enrichment. BP, Biological Process; CC, Cellular Component; MF, Molecular Function; KEGG, Kyoto Encyclopedia of Genes and Genomes. (E–G) eDEGs were sequentially subjected to different analysis. E, univariate Cox regression analysis; F, Lasso analysis; G, multivariate Cox regression analysis. (H) Survival analysis of ZNF330, PITPNM3. (I) Construction of the novel prostate risk model based on ZNF330, PITPNM3 and drawing risk factor plots. (J) Survival analysis of the risk model. (K) Prognostic nomogram based on risk score. (L) Time-dependent ROC curves demonstrated the predictive performance of nomogram. (M) Survival analysis of the validation group cBioPortal-SU2C/PCF. (N) GSEA functional enrichment analysis of the risk model. (O) The clinical correlation analysis between risk model and risk factors of PRAD.

