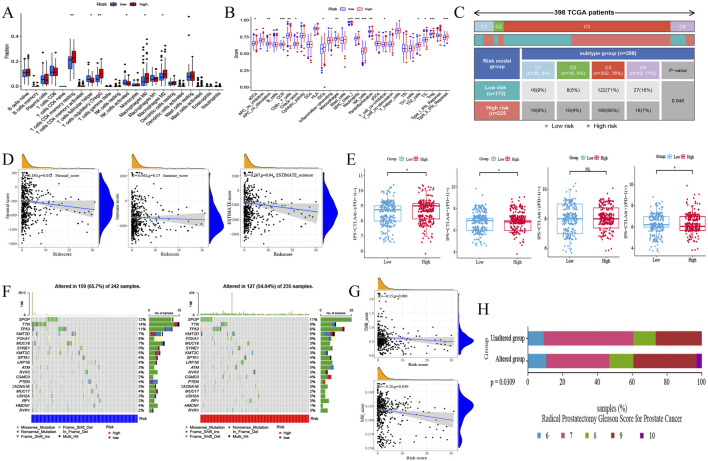
FIGURE 4.
The immune landscape and mutation of risk model. (A) Immune infiltration analysis of risk model. (B) Immune function analysis of risk model. (C) Immunophenotyping analysis of risk model. C1, wound-healing phenotype; C2, IFN-γ dominant phenotype; C3, inflammatory phenotype; C4, lymphocyte-depleted phenotype. (D) Correlation of risk model with stromal score, immune score and estimate score. (E) Correlation of risk model and IPS score. (F) Waterfall plot showing the most frequently mutated genes in the risk model. (G) Mutation analysis of risk model. TMB, tumor mutation burden; MSI, microsatellite instability. (H) Correlation analysis of mutations and Gleason score ratio in PRAD under radical prostatectomy.

