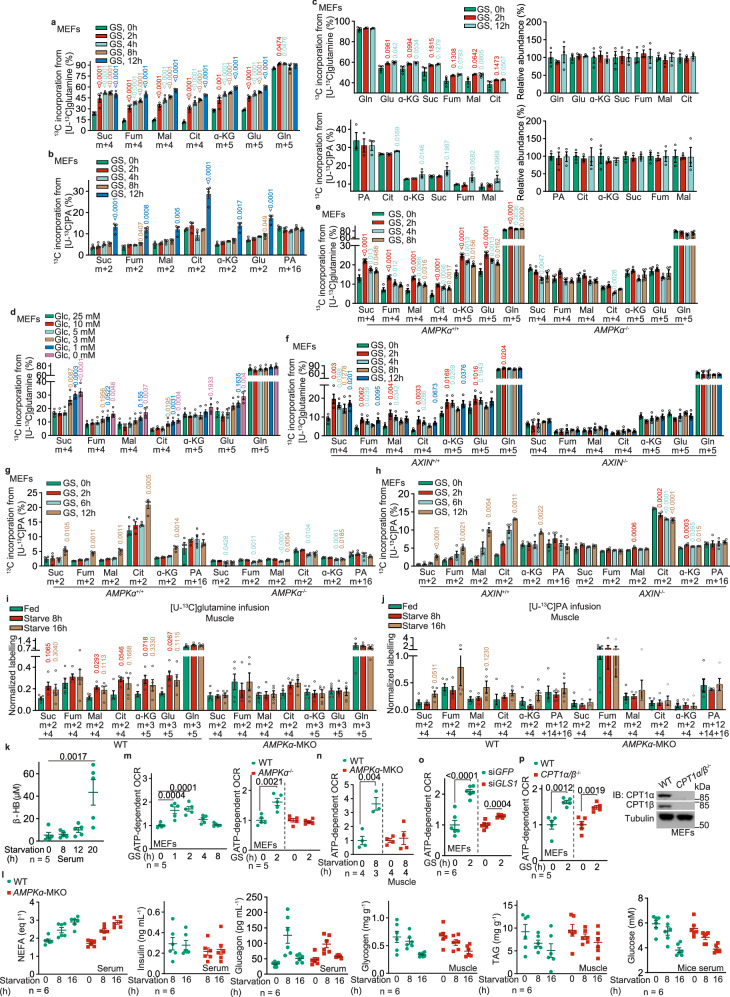
Fig. 1. AMPK promotes glutaminolysis before promoting FAO in low glucose.
a, b, d Glutaminolysis is promoted ahead of the increase of FAO under low glucose. MEFs were glucose starved (GS) for desired durations (a, b), or incubated with a medium containing desired concentrations of glucose (d). At 20 min and 12 h before sample collection, cells were labeled with [U-13C]-glutamine (a, d) and [U-13C]-PA (b), respectively, followed by determination of the levels of labeled TCA cycle intermediates, including succinate (Suc), fumarate (Fum), malate (Mal), citrate (Cit), α-ketoglutarate (α-KG), along with glutamate (Glu), by gas chromatography-mass spectrometry (GC-MS). Levels of m + 5 α-ketoglutarate and glutamate; and m + 4 succinate, fumarate, malate, and citrate that reflect the rates of glutaminolysis (a, d), along with levels of m + 2 α-ketoglutarate, glutamate, succinate, fumarate, malate and citrate that reflect the rates of FAO (b), were shown. See also Supplementary information, Fig. S1b, c, f for the levels of other isotopomers of the labeled metabolites shown in (a, b, and d). Data are shown as mean ± SEM; n = 4 samples for each condition; P values were determined by one-way ANOVA, followed by Dunnett (d), Dunn (fumarate, malate, and α-KG of b), or Sidak (others). P values labeled in these panels represent the comparisons between the starved and the unstarved groups; same hereafter. c Glutamine utilization compensates for the reduction of glucose oxidation in the TCA cycle in low glucose. MEFs were separately labeled with [U-13C]-glutamine and [U-13C]-PA, all for 24 h, followed by glucose starvation for 2 h and 12 h. Show here are the relative contributions of each carbon source to the TCA cycle, as calculated by the total levels of labeled TCA cycle intermediates: ((m + 1) × 1 + (m + 2) × 2 + …… (m + n) × n)/n, in which n represents the number of labeled carbon numbers of each intermediate. See also abundance (pool size; calculated as (m + 0) + (m + 1) + (m + 2) + …… (m + n); all normalized to the unstarved group) of each TCA cycle intermediate on the right panels. Data are shown as mean ± SEM; n = 3 samples for each condition; P values were determined by one-way ANOVA, followed by Dunn (citrate of the upper left panel, and α-KG of lower left panel), Sidak (succinate, fumarate and malate of lower left panel), or Dunn (others). e–h AMPK promotes the utilization of glutamine during early starvation in MEFs. Experiments in e and f (for determining glutaminolysis) were performed as in a, and those in g and h (for determining FAO) as in b) except that AMPKα–/– MEFs (e, g), AXIN–/– MEFs (f, h) were used. Data are shown as mean ± SEM; n = 4 samples for each condition; P values were determined by one-way ANOVA, followed by Dunn (malate and citrate of widetyp (WT) MEFs in f; fumarate, malate, α-KG of WT MEFs and succinate of AMPKα–/– MEFs in g; and malate and citrate of WT MEFs in h or Dunnet (others), all compared to the unstarved group. i, j AMPK promotes the utilization of glutamine during early starvation in mouse muscle. Mice were starved for desired durations, followed by jugular-vein infusion with [U-13C]-glutamine or [U-13C]-PA tracer, for 2 h, respectively. Mice were then sacrificed, followed by determining the rates of glutaminolysis and FAO as in a and b. After normalization to the serum levels of corresponding labeled tracers, data were shown as mean ± SEM; n = 5 samples for each condition; P values were determined by one-way ANOVA, followed by Dunn (fumarate of WT mice, and malate, fumarate, succinate, and PA of AMPKα-MKO mice of j) or Tukey (others), all compared to the unstarved group. k Induction of serum β-hydroxybutyrate, an indicator of hepatic FAO, occurs after prolonged starvation. Mice were starved for desired durations, followed by determining the levels of serum β-hydroxybutyrate (β-HB). Data are shown as mean ± SEM; n = 5 mice for each condition; P values were determined by one-way ANOVA, followed by Tukey. l Muscle-specific knockout of AMPKα does not change the levels of serum free fatty acid (NEFA), insulin and glucagon, plasma glucose, or muscle glycogen and triglyceride (TAG). Data are shown as mean ± SEM; n = 6 mice for each treatment/genotype; P values were determined by two-way ANOVA, followed by Sidak, all compared to the WT group. m, n AMPK axis promotes OCR during early starvation. WT MEFs and AMPKα–/– MEFs (m), or WT and AMPKα-MKO mice (n), were starved for desired durations, followed by determining OCR through Seahorse Analyzer. Data were normalized to the unstarved group of each genotype (same hereafter for all OCR measurements), and are shown as mean ± SEM; n values represent biological replicates for each condition, and were labeled in each panel; P values were determined by one-way ANOVA, followed by Tukey (left panel, m) or by unpaired two-tailed Student’s t-test (others). o, p Inhibition of glutaminolysis, but not FAO, prevents OCR increases. MEFs with GLS1 knockdown (o) or CPT1 knockout (p) were glucose-starved for 2 h (early starvation), followed by determining OCR as in o. Data are shown as mean ± SEM; n = 6 (o) or 5 (p) biological replicates for each condition; P values were determined by unpaired two-tailed Student’s t-test. See also knockout validation data of CPT1 on the right panel of p. Experiments in this figure were performed three times, except experiments in i were performed four times.

