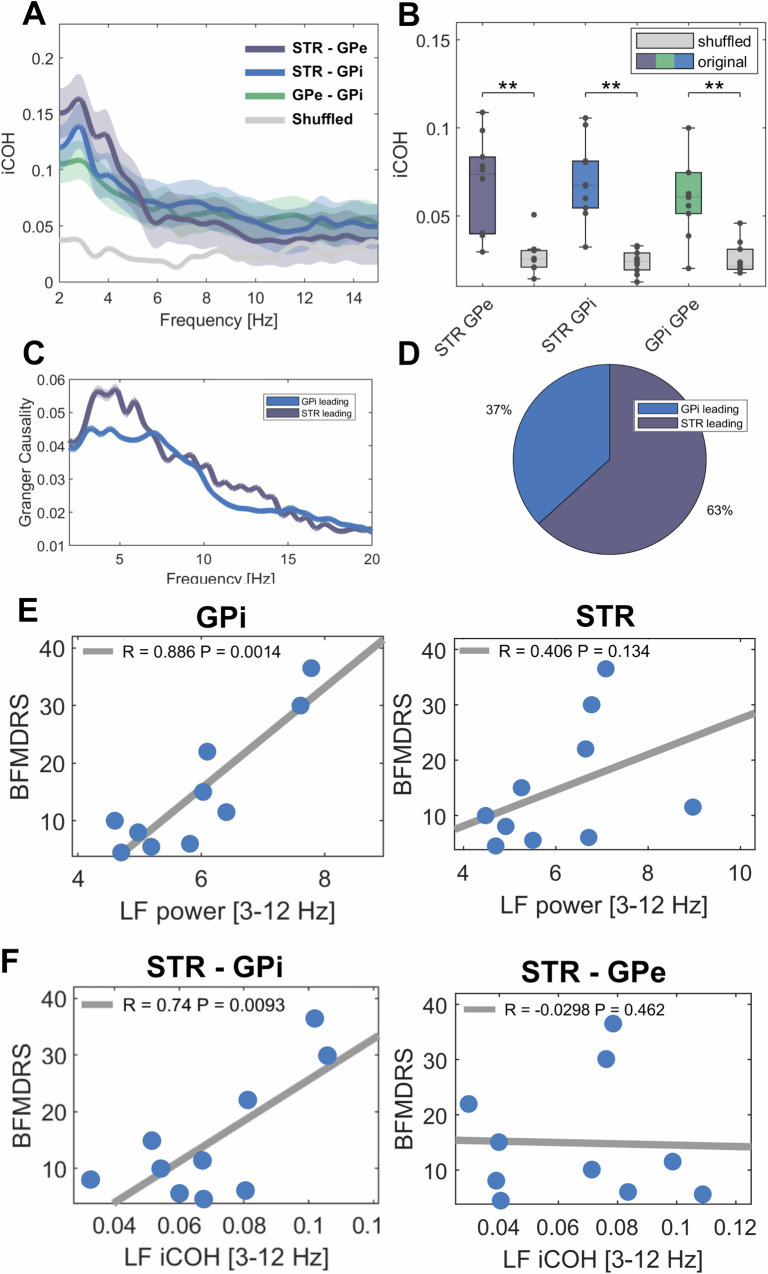
Fig. 3. Connectivity patterns across basal ganglia structures and their correlation to symptom severity.
A Shown are averaged coherence spectra (iCOH= imaginary part of coherence) between striatum and GPe (purple), striatum and GPe (blue), GPe and GPi (green) and averaged shuffled coherence (grey) across hemispheres. Shaded areas indicate standard deviation of the mean. B All recorded basal ganglia structures are functionally coupled in the low-frequency band as shown by significantly higher coherence values (colored box plots) when compared to shuffled data (grey box plots); STR-GPi: P = 0.002; STR-GPe: P = 0.003; GPi-GPe: P = 0.003 as validated by permutation tests and FDR-corrected for multiple comparisons. Black dots indicate mean value of coherence per hemisphere (n = 19 per basal ganglia structure). In box plots, the whiskers indicate minimal and maximal values per hemisphere, the central marks indicate the median and edges the 25th and 75th percentiles of the distribution. C Shown are averaged spectra of Granger causality with GPi (blue) or striatum (purple) as source. Shaded areas indicated standard deviation of the mean. D When each frequency bin is considered separately, the majority of the low-frequency band is led by the striatum in 63% and by the GPi in 37% of cases. E Dystonic symptom severity correlates with averaged low-frequency power in the GPi, but not the striatum. F Moreover, the significant coupling strength of low-frequency activity between the striatum and the GPi, but not between striatum and GPe hints towards an involvement of the direct but not the indirect pathway. E, F show Pearson’s correlation coefficients. **p < 0.01.

