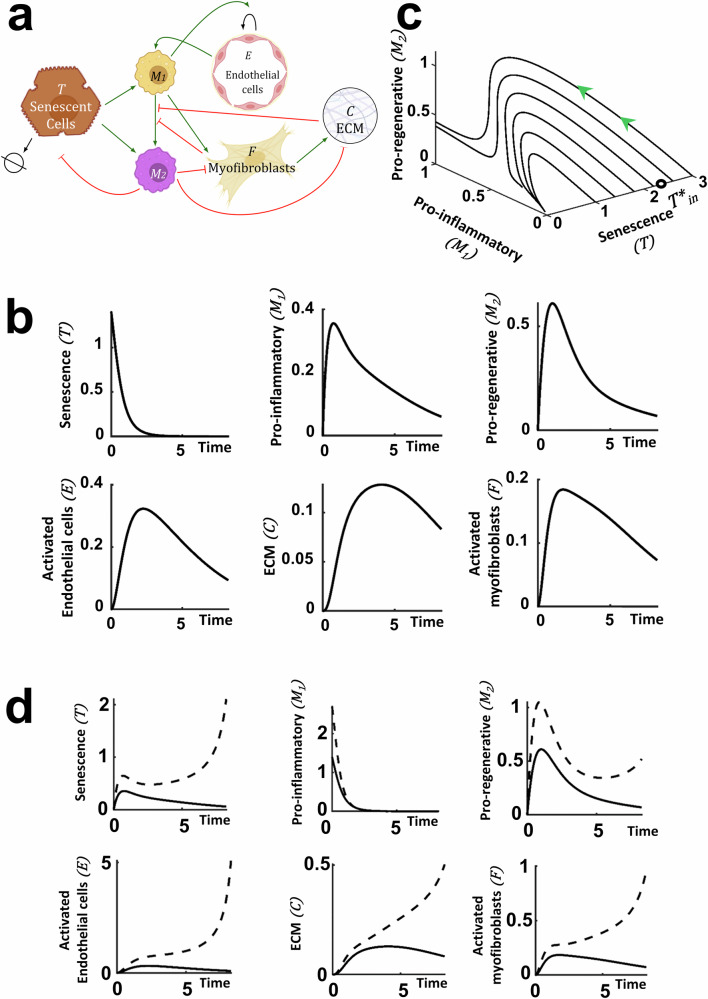
Fig. 3. Mathematical model of senescence driven liver injury highlighting numerical predictions of the injury dynamics for a ‘medium’ senescence level.
All numerical simulations were computed with parameter values set equal to 1, apart from the value of the initial senescence which is given in the caption. a Schematic of the injury model where the variables and their interactions are presented. Green arrows indicate promotion and flat head red arrows indicate inhibition. Elements of this panel were produced using biorender.com. b Mathematical prediction of the time evolution of all system components for a ‘medium’ initial senescence, . c Mathematical prediction of the evolution of M1 and M2 for different initial induced senescence levels. Above the critical initial senescence, denoted by (black circle), the values of M1 and M2 do not return to the homoeostatic values, indicating uncontrolled inflammation. d Mathematical prediction of the time evolution of all variables for the standard ‘medium’ initial senescence (solid line) and at , which is above the critical initial senescence (dashed line). As in (c), all the values do not reach a homoeostatic level, but keep increasing.

