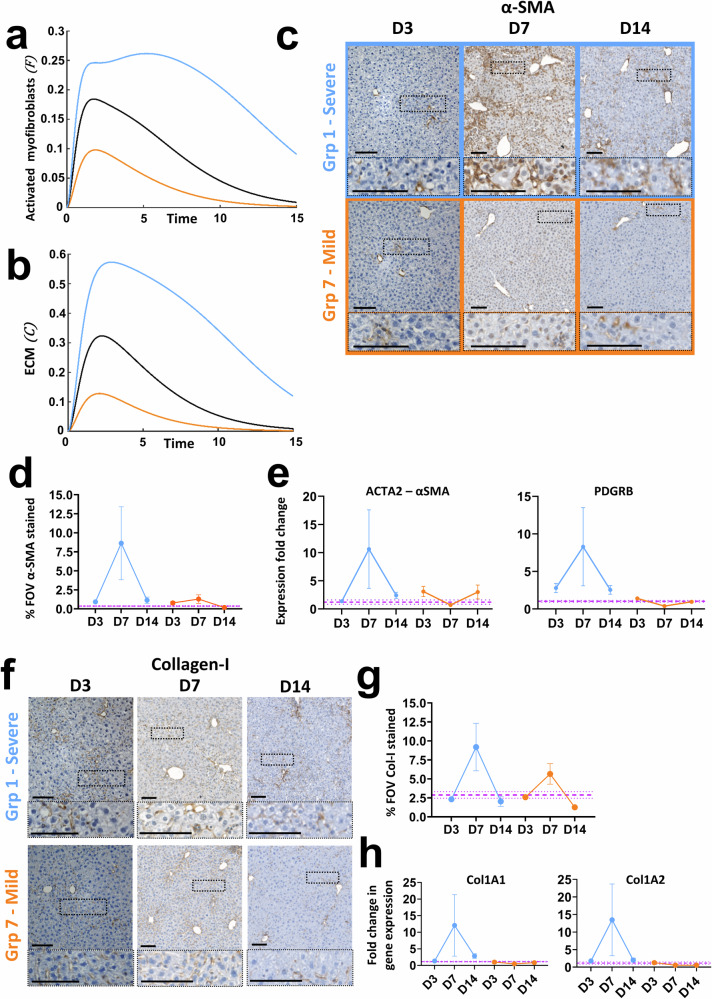
Fig. 6. Mathematical predictions for tissue remodelling via evolution of activated myofibroblasts and ECM at High, Medium and Low doses of initial senescence match characterisation results following induction of severe and mild senescence driven liver injury in Mdm2 mice.
All numerical simulations were computed with rates equal to 1. For numerical simulations the light blue line represents the low dose, orange line the high and black the medium level of senescence, and , respectively. For biological doses orange and light blue refer to severe (group 1) and mild (group 7) injury respectively. Purple dashed lines are healthy control mean ± SEM. qPCR results were normalised to PPIA housekeeper and expressed as fold change relative to healthy control mean expression. N = 3–5 mice per group and timepoint analysed. Error bars are SEM. Mathematical prediction for evolution of activated myofibroblasts (a) and ECM (b) for High, Medium and Low senescence over time. Different levels of senescence induce a transient, senescence dependent increase in both populations before dropping to homoeostatic values. c, d Representative histological micrographs and quantification showing the transient, dose-dependent increase in staining for the activated myofibroblast marker α-SMA. Scale bars 100 µm. e Analysis of changes in gene expression of the activated myofibroblast markers α-SMA and PDGFRB over time by qPCR. f, g Representative histological micrographs and quantification showing the transient, dose-dependent increase in staining for collagen-I. Scale bars 100 µm. h Analysis of changes in gene expression of the pro-alpha1 and pro-alpha2 chains of collagen-I (COL1A1 and COL1A2) over time by qPCR.

