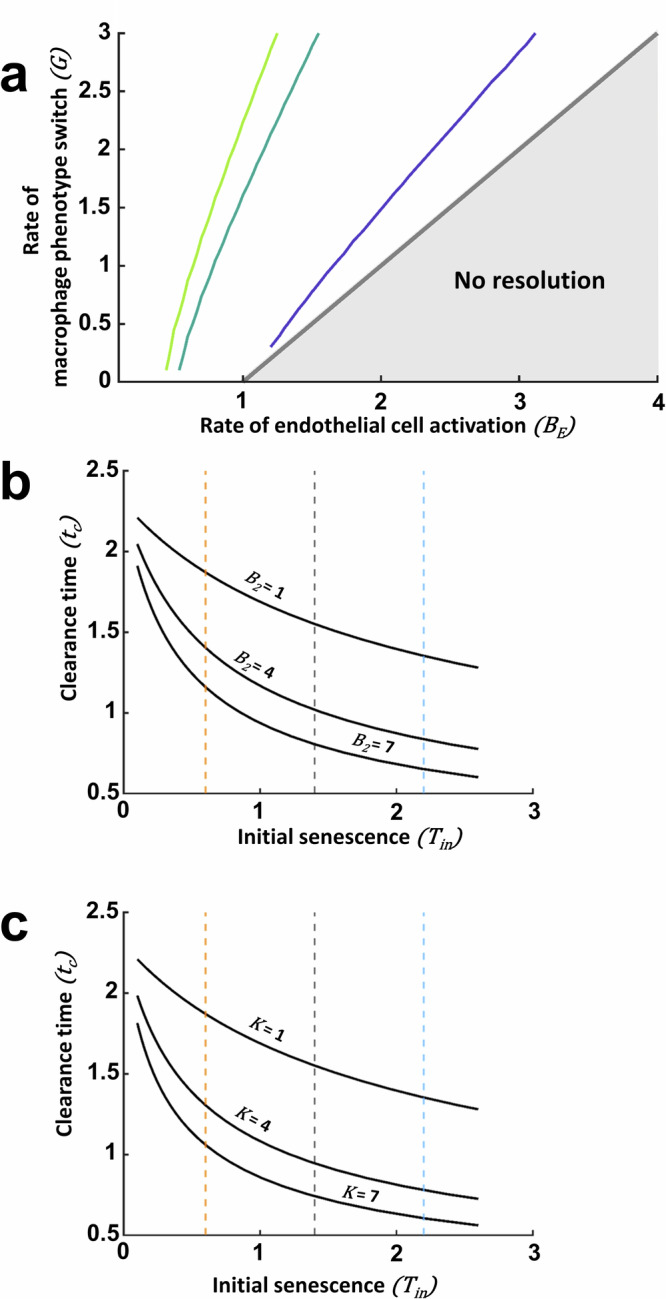
Fig. 7. Mathematical predictions for critical initial senescence and clearance time based on the different rates of the system.

Parameter study on the effect in critical initial senescence and clearance time (. a Effect of rate of macrophage phenotype switch () and endothelial cell activation on critical initial senescence. All other parameters are set to 1. The pale green, dark green and purple lines are contours of = 0.5, 5.5 and . An increase in allows higher critical initial senescence while an increase in permits smaller initial senescence levels before uncontrollable inflammation of the system is triggered. b Effect of the rate of recruitment, , on clearance time for different initial levels of senescence, . An increase results in faster clearance and therefore lower . Orange, black and blue dashed lines represent Low, Medium and High initial senescence levels respectively. c Effect of the rate of senescent cell removal by , , on clearance time for varying initial senescent values. An increase in this rate will result in faster clearance and therefore lower . Orange, black and blue dashed lines represent numerically Low, Medium and High initial senescence levels respectively.
