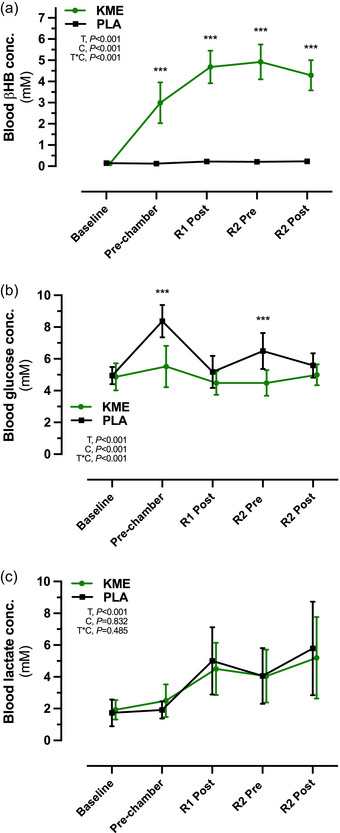
FIGURE 2.

Blood R‐βHB (a), glucose (b) and lactate (c) concentrations during ketone monoester (KME) and placebo (PLA) conditions at Baseline, Pre‐chamber, after ruck 1 (R1 Post) and before and after ruck 2 (R2 Pre and R2 Post, respectively). Data are presented as the mean ± SD. Abbreviations: C, condition (KME vs. PLA); PLA, placebo; R‐βHB, (R)‐3‐hydroxybutyrate; T, time; T*C, time × condition interaction. ***P < 0.001 for KME versus PLA.
