
FIGURE 4.
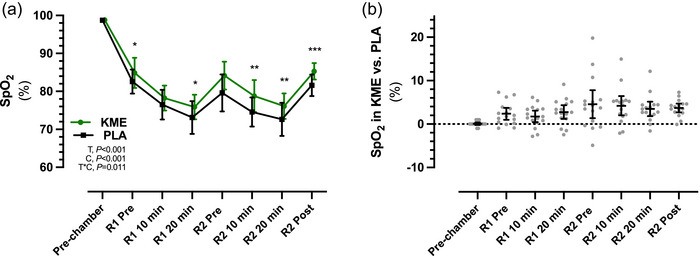
Average oxygen saturation () (a), and mean differences in between trials (b), during ketone monoester (KME) and placebo (PLA) conditions at Pre‐chamber, and before (Pre) and during (10 and 20 min) ruck 1 (R1) and ruck 2 (R2). Data are presented as the mean ± SD in (a) and as the mean ± 95% confidence limits in (b). Abbreviations: C, condition (KME vs. PLA); T, time; T*C, time × condition interaction. *P < 0.05, **P < 0.01 and ***P < 0.001 for KME versus PLA.