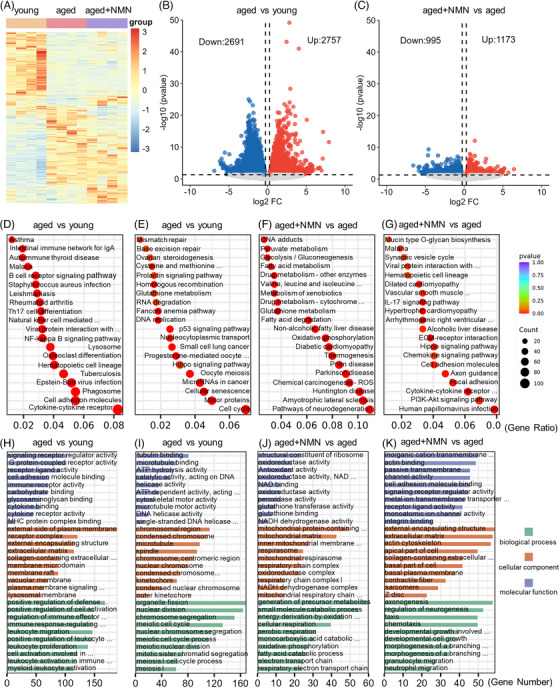
FIGURE 5.

Ovarian transcriptome analysis reveals the mechanism through which NMN inhibits ovarian aging. (A) Heatmap showing the gene expression profiles in the ovaries of young, aged, and aged + NMN groups of mice (n = 4 mice per group). (B and C) Volcano plots depicting the differentially expressed genes (DEGs) in aged versus young and aged + NMN versus aged groups of mouse ovaries. Some highly expressed DEGs are listed. Downregulated genes are indicated in blue, and upregulated genes are indicated in red. (D–G) Kyoto Encyclopedia of Genes and Genomes (KEGG) enrichment analysis of upregulated and downregulated DEGs in the ovaries of aged versus young and aged + NMN versus aged mice. (H–K) Gene Ontology (GO) enrichment analysis of upregulated and downregulated DEGs in the ovaries of aged mice versus young mice and aged + NMN mice.
