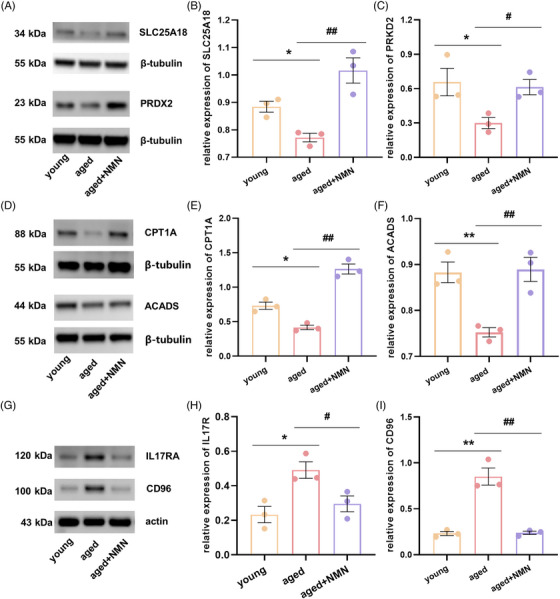
FIGURE 6.

Validation of the transcriptome analysis results through protein immunoblotting. (A) Immunoblot images for the mitochondrial function‐related proteins solute carrier family 25 member 18 (SLC25A18) and peroxiredoxin 2 (PRDX2). (B and C) Changes in the expression of the mitochondrial function‐related genes SLC25A18 and PRDX2 in the ovaries of young, aged, and aged + NMN mice (n = 3 mice per group). (D) Immunoblot images for the fatty acid oxidation‐related proteins carnitine palmitoyltransferase 1A (CPT1a) and acyl‐CoA dehydrogenase short chain (ACADS). (E and F) Changes in the expression of the fatty acid oxidation‐related genes CPT1A and ACADS in the ovaries of young, aged, and aged + NMN mice (n = 3 mice per group). (G) Immunoblot images for the inflammation‐related proteins interleukin‐17 receptor A (IL17RA) and CD96. (H and I) Changes in the expression of the inflammation‐related genes IL17RA and CD96 in the ovaries of young, aged, and aged + NMN mice (n = 3 mice per group). The data are presented as the means ± SEMs. * or #, p < 0.05; ** or ##, p < 0.01.
