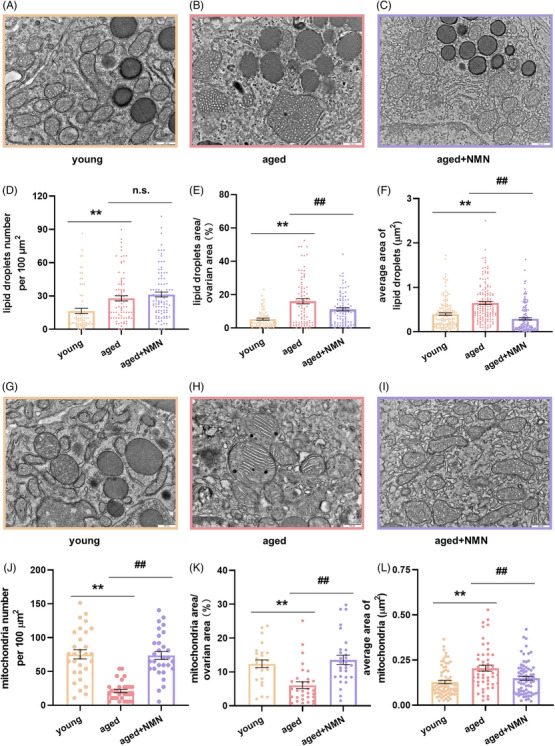
FIGURE 8.

Effect of NMN supplementation on lipid droplets and mitochondria within ovaries. (A–C) Representative images showing lipid droplets in the ovaries of the mice in the young, aged, and aged + NMN groups. Scale bar, 500 µm. (D–F) Statistical analysis of the number of lipid droplets per unit area, the ratio of lipid droplet area to ovarian area (n = 72 figures from young mice, 84 figures from aged mice, and 95 figures from aged + NMN mice,4 mice from each group were analyzed), and the average area occupied by lipid droplets (n = 147 lipid droplets per group from 4 mice) in electron microscopy images. (G–I) Representative electron microscopy images of mitochondria in the ovaries of young, aged, and aged + NMN groups. Scale bar, 500 µm. (J–L) Statistical analysis of the number of mitochondria per unit area and the ratio of total mitochondrial area to ovarian area (n = 72 figures from the mice in the young group, 84 figures from the mice in the aged group, and 95 figures from the mice in the aged + NMN group; 4 mice from each group were analyzed) and the average area occupied by mitochondria (n = 72 mitochondria from the young group, 51 mitochondria from the aged group, and 70 mitochondria from the aged + NMN group; 4 mice from each group were analyzed) in electron microscopy images from different groups. The data are presented as the means ± SEMs. ** or ##, p < 0.01.
