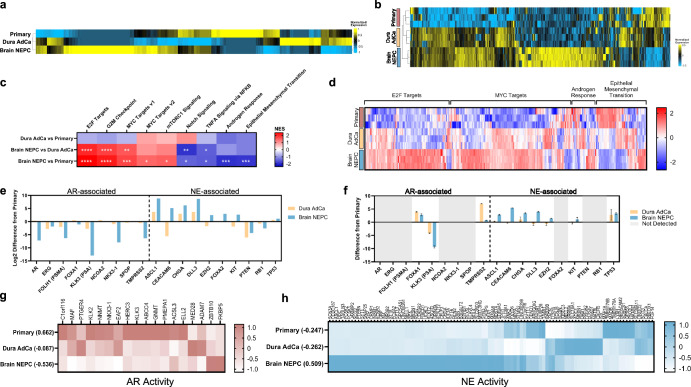
Fig. 2. AR and NE features distinguish sample subtypes.
Heatmap of transcriptome (a) and proteome (b) with unsupervised hierarchical clustering. c Heatmap of normalized enrichment scores from GSEA analysis, with significance marked (*FDR < 0.05, **FDR < 0.01, ***FDR < 0.001, ****FDR < 0.0001). d Heatmap of protein expression of genes in Hallmark pathways identified in (c). Panel of AR- and NE-associated genes and the difference of expression in transcriptome (e) and proteome (f) in the metastatic dura adenocarcinoma or metastatic brain neuroendocrine samples from the primary prostate. Error bars indicate standard error of the mean. Heatmap of AR activity (g) or NE activity (h) genes in the transcriptome, with the summative z-score calculation for each sample.

