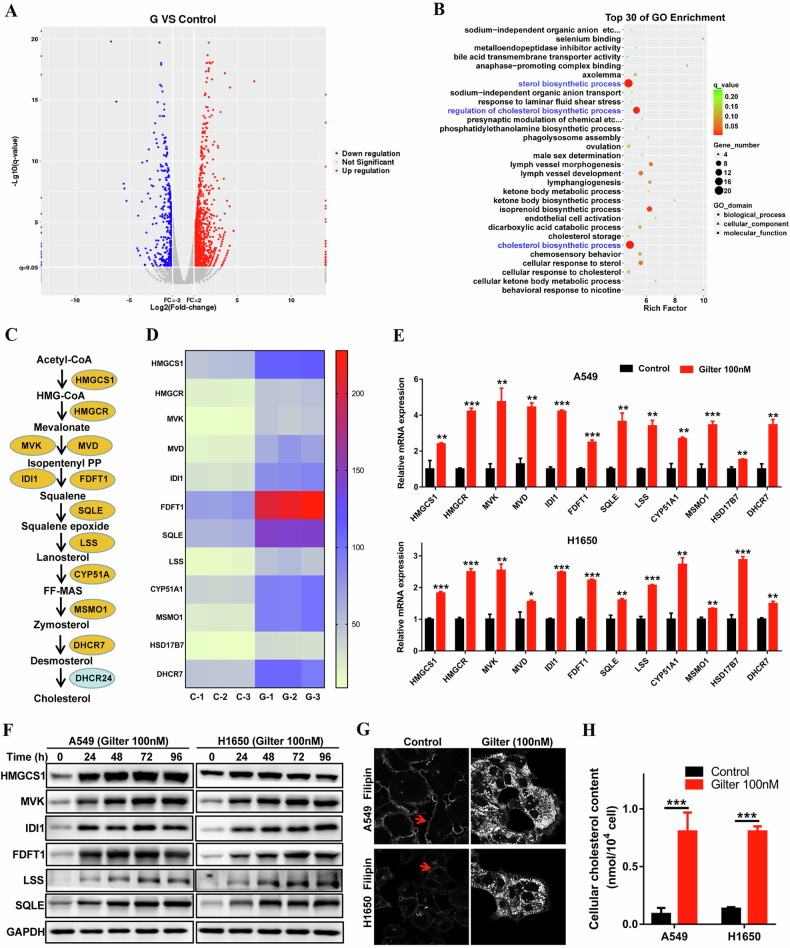
Fig. 2. Distinct expression profiles of gilteritinib-treated A549 cells using RNA sequencing.
A Volcano plot shows the differentially expressed genes between untreated and gilteritinib-treated A549 cells. B Go term analyses of differentially expressed genes between untreated and gilteritinib-treated A549 cells. C The enzymes involved in the cholesterol biosynthesis pathway. D Heat map of cholesterol biosynthesis genes in untreated and gilteritinib-treated A549 cells using RNA-seq data. E After 48 h treatment of 100 nM gilteritinib, the mRNA expressions of cholesterol biosynthesis genes in A549 and H1650 cells were measured by qRT-PCR. F Representative immunoblot of the cholesterol biosynthesis proteins (HMGCS1, MVK, IDI1, FDFT1, SQLE, LSS) in A549 and H1650 cells treated with 100 nM gilteritinib in a time-dependent manner. G After 48 h treatment with 100 nM gilteritinib, free cholesterol in A549 and H1650 cells was detected using filipin staining. H After 48 h treatment with 100 nM gilteritinib, total cholesterol was measured using the total cholestenone (TC) content assay Kit. *P < 0.05, **P < 0.01, ***P < 0.001.

