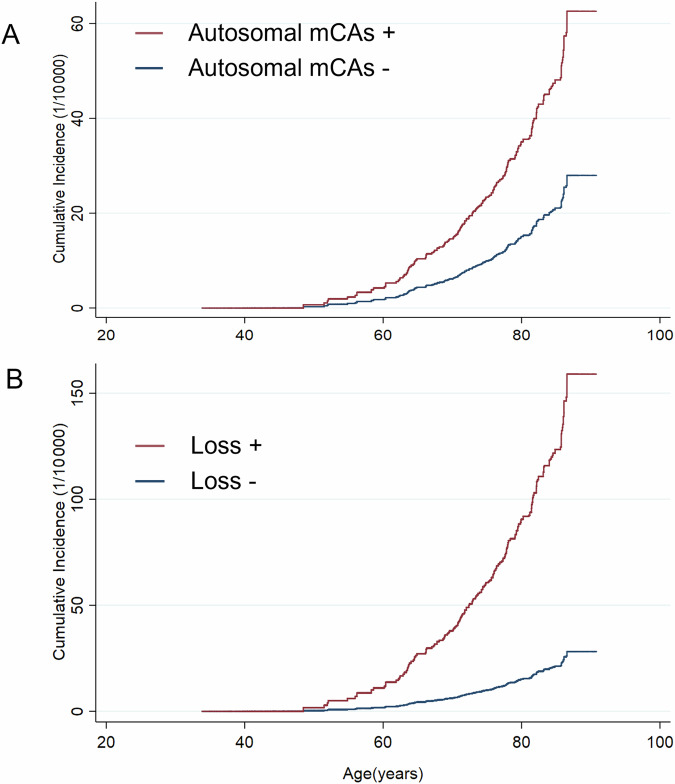
Fig. 1. Cumulative incidence curves of bladder cancer by mCAs status.
Cumulative incidence of bladder cancer for participants with or without autosomal mCAs (A) and mosaic loss (B). Cause-specific hazard models were used to account for the competing risk of death. Model for bladder cancer and model for death from other causes were separately developed, with the same set of variables (as same as model 3 in Table 2) included in both models. Cumulative incidences were estimated and plotted by the status of mCAs and mosaic loss, with all covariates being set to the average level of the study population. mCAs, mosaic chromosomal alterations.

