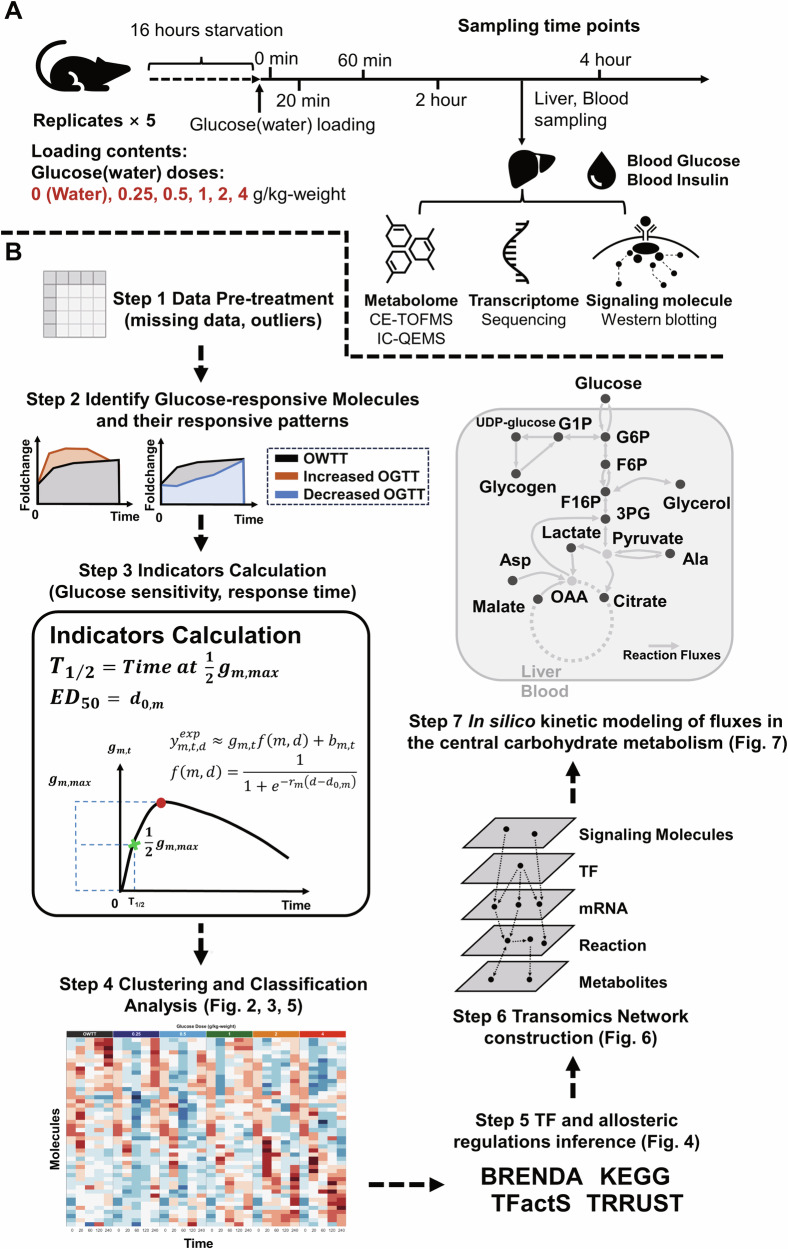
Fig. 1. Overview of the transomic analysis and kinetic modeling of dose-dependent glucose-responsive metabolism in the liver.
A We used WT mice and collected the liver and blood samples from 16 h-fasted mice after six doses of oral glucose administration. We measured the time series data of signaling molecules, gene expression, metabolites in the liver, glucose, and insulin in the blood. We used n = 5 as the mouse replicates for each time point in the analysis. B The seven steps for the analysis of time- and dose-dependent glucose metabolism in the transomic network in the liver.

