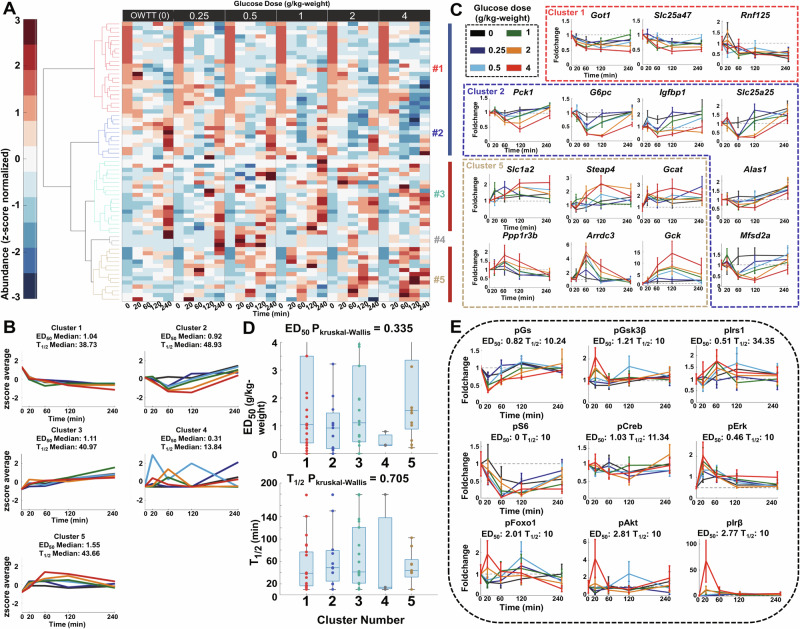
Fig. 3. Identification of dose-dependent glucose-responsive genes and insulin signaling molecules.
A The time courses of dose-dependent glucose-responsive genes from the livers after administration of six doses of oral glucose (n = 5 mice per dose at all time points). Six-time courses for each gene were z-score normalized. Genes were ordered by hierarchical clustering using Euclidean distance and Ward’s method (Table 2, Supplementary Data 6). The colors of the dendrogram represent the clustering results (Red: Cluster 1, Blue: Cluster 2, Cyan: Cluster 3, Gray: Cluster 4, Gold: Cluster 5) B z-score the average of time courses of genes in each cluster and the median ED50 and T1/2 of these clusters. This panel shared the same legend as Fig. 3C. C Highlighted time courses of dose-dependent glucose-responsive genes in each cluster. The colors of the boxes show the clustering result of highlighted genes. Data are shown as the mean and SEM of five mice per dose. Genes are abbreviated as follows: Got1 glutamic-oxaloacetic transaminase, Slc25a47 solute carrier family 25 member 47, Rnf125 ring finger protein 125, Pck1 phosphoenolpyruvate carboxykinase 1, G6pc Glucose-6-phosphatase, Igfbp1 insulin-like growth factor binding protein 1, Slc25a25 solute carrier family 25 member 25, Alas1 5’-aminolevulinate synthase 1, Mfsd2a major facilitator superfamily domain-containing 2A, Slc1a2 solute carrier family 1 member 2, Steap4 six-transmembrane epithelial antigen of prostate 4, Gcat glycine C-acetyltransferase, Ppp1r3b protein phosphatase 1 regulatory subunit 3B, Arrdc3 arrestin domain-containing 3, Gck glucokinase, (Black: 0 g/kg [OWTT], Blue: 0.25 g/kg, Cyan: 0.5 g/kg, Green: 1 g/kg, Orange: 2 g/kg, Red: 4 g/kg). D Boxplot of ED50 (Left) and T1/2 (Right) for each cluster. Kruskal–Wallis tests for ED50 and T1/2 in each cluster were conducted to investigate whether there was statistical significance. The P values of the Kruskal–Wallis tests are shown above the boxplot. E Time courses, ED50 and T1/2 of dose-dependent glucose-responsive phosphorylation of insulin signaling molecules. Data are shown as the mean and SEM of five mice per dose. Insulin signaling molecules are abbreviated as follows: GS glycogen synthase, GSK3β glycogen synthase kinase 3 beta, IRS1 insulin receptor substrate 1, S6 ribosomal protein S6, CREB cAMP-response element-binding protein, ERK mitogen-activated protein kinase 1, FOXO1 forkhead box protein O1, AKT serine/threonine-specific protein kinase, IRβ insulin receptor β. This panel shared the same legend as (C).

