
Fig. 2. Identification of ligand-specific AT1R C-terminal tail phosphorylation patterns.
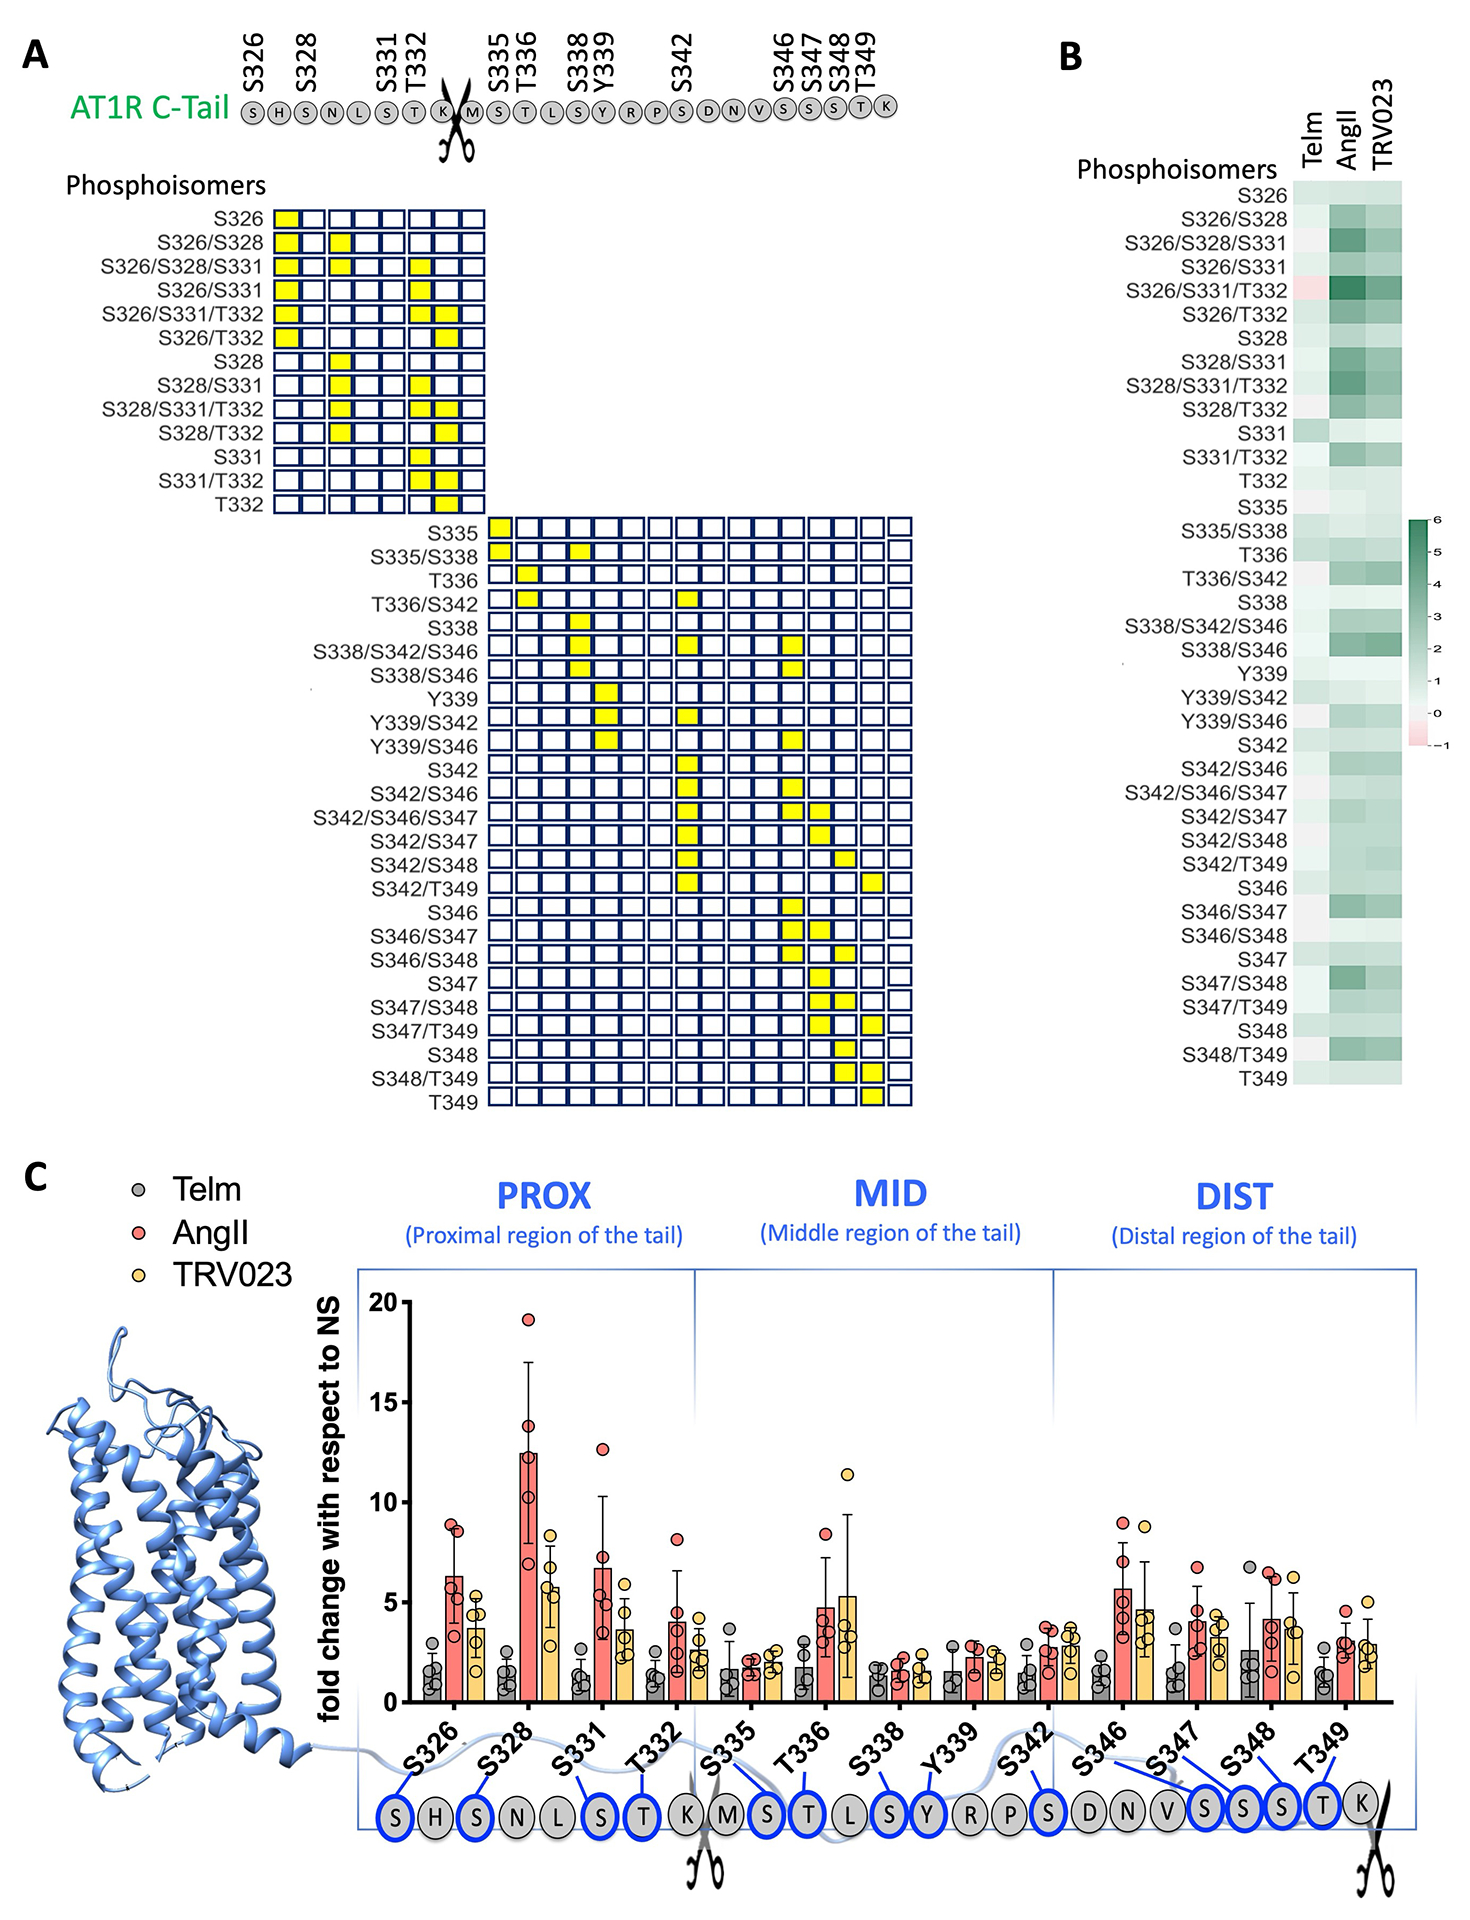
(A) Graphical representation of the location of phosphorylated sites (yellow squares) along the C-terminal tail peptides (open squares). Scissors indicate the trypsin cleavage site. (B) Heatmap showing the amounts of phosphorylation of the indicated AT1R C-terminal tail phosphoisomers in AT1R-expressing Expi293F™ cells stimulated the AT1R inhibitor Telm, the full AT1R agonist Angiotensin II (AngII), and the β-arrestin-biased AT1R agonist TRV023. Quantitative data were obtained by MS and are reported as fold change compared to cells that were not stimulated (NS). All of the phosphoisomers identified by MS after post-database searching analysis are included in the heatmap. N=5 independent experiments per treatment group. (C) Intensity of each single phosphosite in the proximal (PROX), middle (MID), and distal (DIST) portions of the AT1R C-terminal tail after stimulation with Telm, AngII, or TRV023, as determined from the single-site analysis (see Materials and Methods). N=5 independent experiments per treatment group.