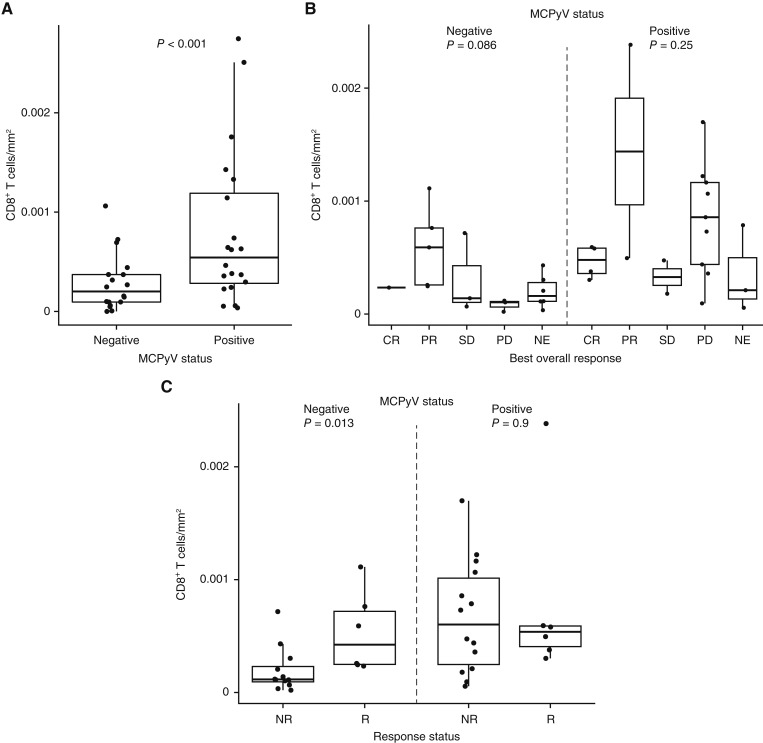
Figure 3.
Digital pathology analysis of CD8+ T-cell density at the invasive margin in samples from the 2L+ cohort according to (A) MCPyV status and (B and C) response and MCPyV status. CR, complete response; NE, not evaluable; NR, nonresponder; PD, progressive disease; PR, partial response; R, responder; SD, stable disease.

