Figure 2.
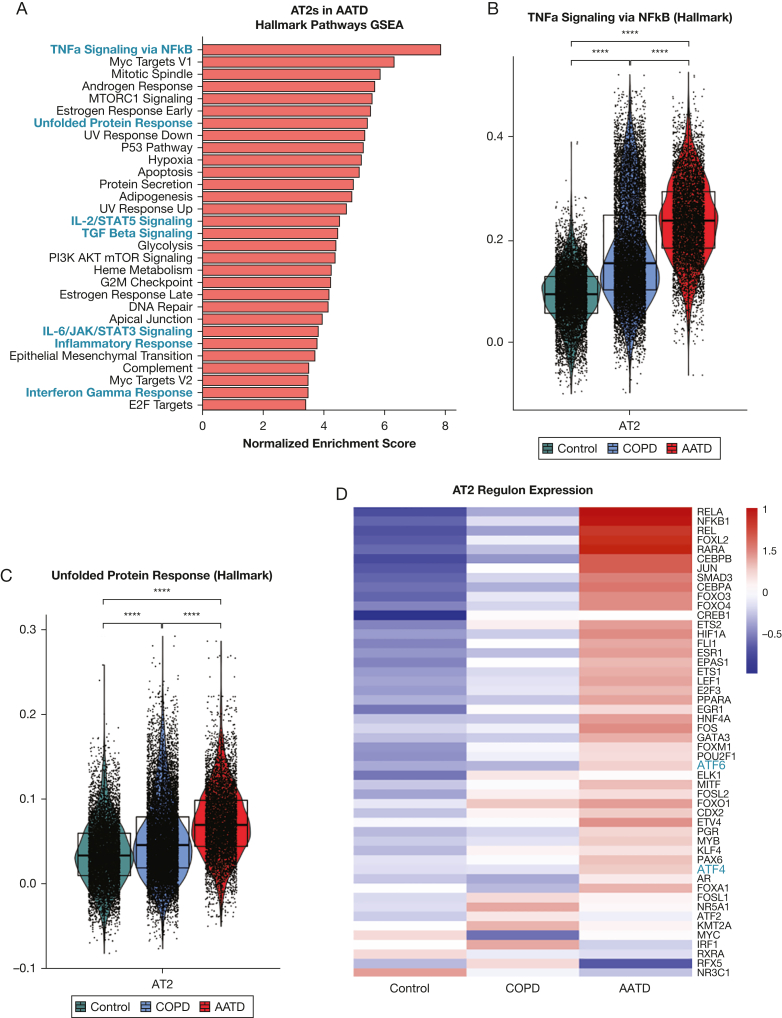
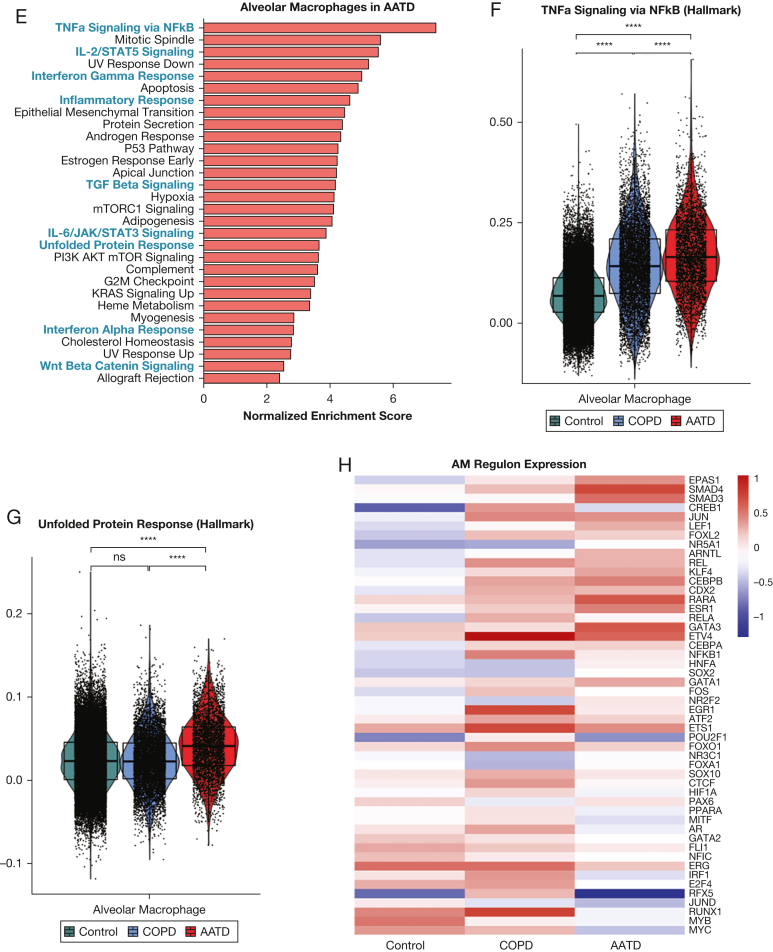
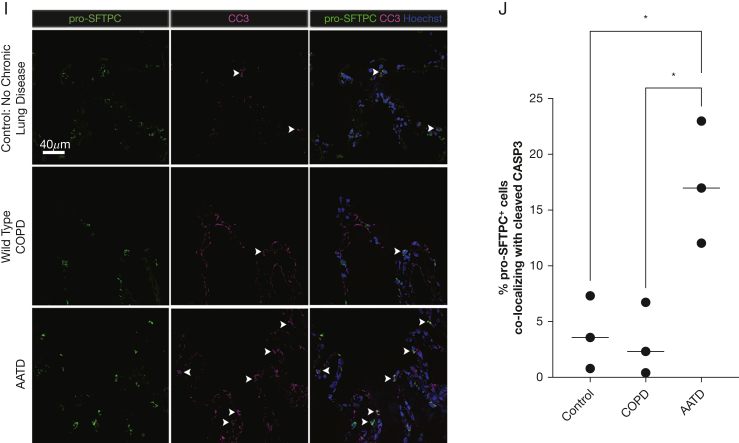
SERPINA1 expression correlates with cellular stress in alveolar type 2 cells (AT2s) and in alveolar macrophages in patients with alpha-1-antitrypsin deficiency (AATD) homozygous for the Z mutation (ZZ-AATD). (A) Gene Set Enrichment Analysis (GSEA, using Hallmark gene sets, adjusted P < .01, false discovery rate [FDR] < 0.05) of differentially upregulated transcripts in AT2s in AATD compared with all AT2s. Blue text identifies gene sets discussed in the text. (B) Violin plot of module score for Hallmark 2020 gene set term “TNFa Signaling via NFkB” in AT2s split by disease state of donor. (∗∗∗∗P < .0001, Wilcoxon rank-sum test). (C) Violin plot of module score for Hallmark 2020 gene set term “Unfolded Protein Response” in AT2s split by disease state of donor. (∗∗∗∗P < .0001, Wilcoxon rank-sum test). (D) Heat map of differential regulon (curated set of transcription factor target transcripts) expression in AT2s. Regulon analysis was performed for differentially expressed transcripts in AT2s in AATD compared with all AT2s using DoRothEA confidence level “A” interactions.24 The top 50 most variable regulons are plotted, ranked by difference between AATD and Control. (E) GSEA (using Hallmark gene sets, adjusted P < .01, FDR < 0.05) of differentially upregulated transcripts in alveolar macrophages in AATD compared with all alveolar macrophages. Blue text identifies gene sets discussed in the text. (F) Violin plot of module score for Hallmark 2020 gene set term “TNFa Signaling via NFkB” in alveolar macrophages split by disease state of donor. (∗∗∗∗P < .0001, Wilcoxon rank-sum test). (G) Violin plot of module score for Hallmark 2020 gene set term “Unfolded Protein Response” in alveolar macrophages split by disease state of donor. (∗∗∗∗P < .0001, Wilcoxon rank-sum test). (H) Heat map of differential regulon (curated set of transcription factor target transcripts) expression in alveolar macrophages (AM). Regulon analysis was performed for differentially expressed transcripts in AMs in AATD compared with all AMs using DoRothEA confidence level “A” interactions.26 Top 50 most variable regulons are plotted, ranked by difference between AATD and control. (I) Representative immunofluorescence images of cleaved caspase 3 (magenta) and pro-SFTPC (green) in distal human lung tissue from wild-type COPD, ZZ-AATD, and control/no COPD donors. (J) Quantification of CC3+/pro-SFTPC+ cells relative to the total number of pro-SFTPC+ cells (∗P < 0.05, one-way analysis of variance). N = 9 donors (3 wild-type COPD, 3 ZZ-AATD, 3 control/no COPD). NFkB = nuclear factor kappaB; pro-SFTPC = pro-surfactant protein C; TGF = transforming growth factor; TNF = tumor necrosis factor.


