Figure 1.
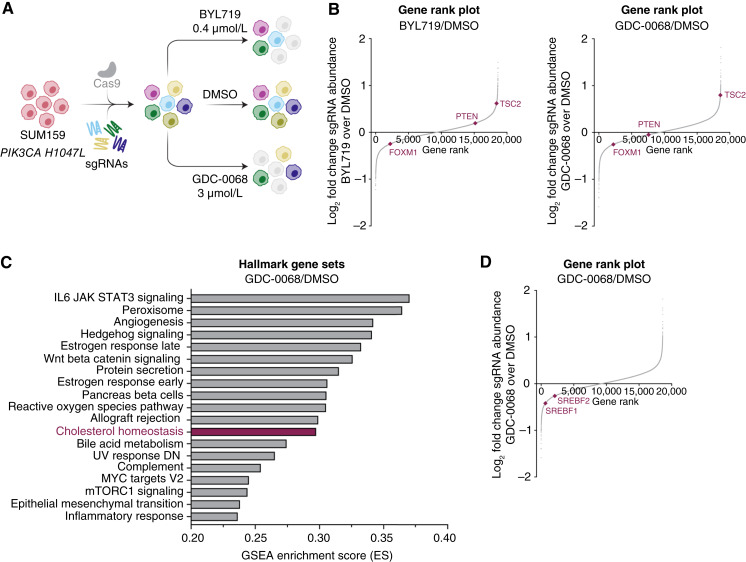
Genome-wide CRISPR/Cas9 screen identifies synergy with combined AKT inhibition and cholesterol homeostasis gene knockout in TNBC cells. A, Schematic of CRISPR/Cas9 screen. SUM159 cells were transduced with a Cas9-expressing lentivirus containing 94,495 sgRNAs with 3 to 4 sgRNAs per gene. Infected cells were allowed to grow for approximately 1 week before seeding the treatment arms. Cells were treated with DMSO, BYL719 (PI3Kα-selective inhibitor, 0.4 µmol/L), or GDC-0068 (catalytic AKT inhibitor, 3 µmol/L) for 72 hours (N = 3 technical replicates for each treatment arm). B, Rank plots showing the log2-fold change of each gene plotted against the dropout gene rank for the BYL719 and GDC-0068 treatments arms compared with the DMSO arm. Expected changes in PI3K/AKT signaling genes are highlighted, including TSC2, PTEN, and FOXM1. Plots were generated using MAGeCK with a read count cutoff of 50 (N = 3 technical replicates). C, Plot of the top pathways selectively perturbed in the GDC-0068 arm of the CRISPR/Cas9 screen. Analysis was performed via gene set enrichment analysis. D, Rank plot showing the log2-fold change of each gene plotted against the dropout gene rank for the GDC-0068 treatment arm of the CRISPR/Cas9 screen compared with the DMSO arm. The transcription factors SREBF1 and SREBF2 are highlighted. The plot was generated using MAGeCK with a read count cutoff of 50.

