Figure 2.
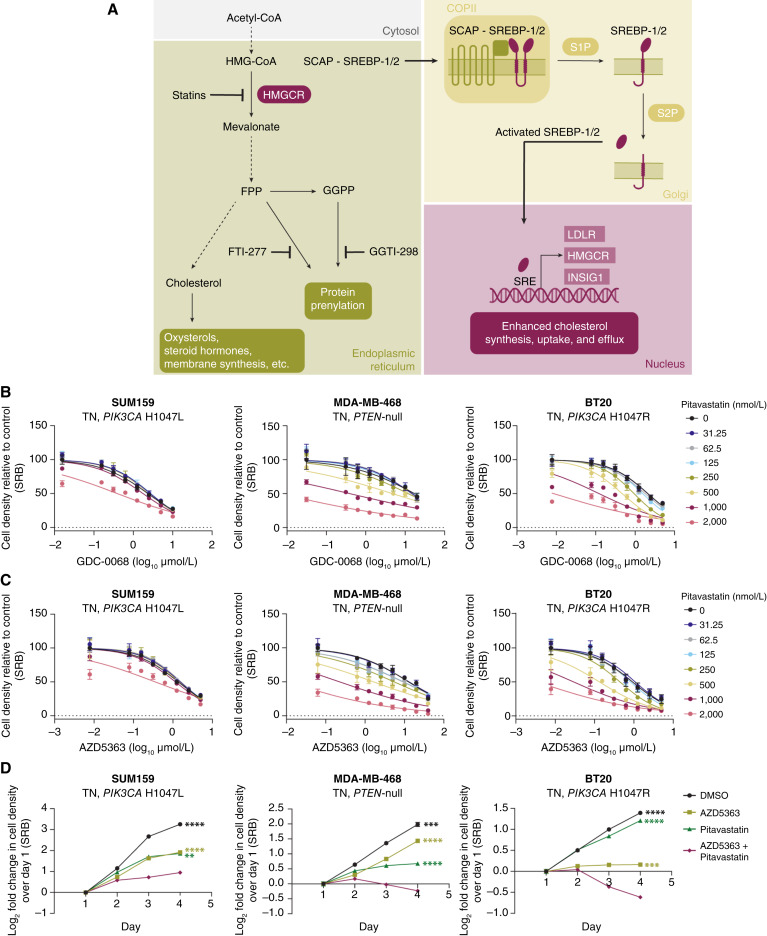
Disruption of cholesterol homeostasis synergizes with AKT inhibition in TNBC cells. A, Cholesterol is synthesized in multiple steps from acetyl-CoA. HMGCR catalyzes the first rate-limiting step of cholesterol biosynthesis. This pathway also generates the prenylation substrates FPP and GGPP. SREBP-1/2 sense low endoplasmic reticulum cholesterol levels and translocate from the endoplasmic reticulum to the Golgi where they are cleaved and activated. N-terminal active SREBP-1/2 enter the nucleus to regulate the transcription of target genes. Drugs targeting this pathway are highlighted, including HMGCR inhibitors (statins) and inhibitors of protein farnesylation (FTI-277) and geranylgeranylation (GGTI-298). B and C, TNBC cell lines (SUM159, MDA-MB-468, and BT20) were treated with increasing doses of GDC-0068 (SUM159, 0–10 µmol/L; MDA-MB-468, 0–20 µmol/L; and BT20, 0–5 µmol/L; B) or AZD5363 (SUM159, 0–5 µmol/L; MDA-MB-468, 0–40 µmol/L; BT20, 0–5 µmol/L; C) and pitavastatin (0–2,000 nmol/L) for 72 hours, and cell density was measured by SRB assay. Data are represented as mean ± SD (N = 3 technical replicates). D, TNBC cell lines (SUM159, MDA-MB-468, and BT20) were treated with DMSO, AZD5363 (SUM159, 2.5 µmol/L; MDA-MB-468, 10 µmol/L; BT20, 1.25 µmol/L), pitavastatin (SUM159, 4 µmol/L; MDA-MB-468, 2 µmol/L; BT20, 0.5 µmol/L), or a combination of AZD5363 and pitavastatin for 72 hours, and cell density was measured daily by SRB assay. Data are represented as mean ± SD (N = 3 technical replicates). Statistical analysis was performed using two-way ANOVA with Dunnett multiple comparison test. *, significant differences compared with the AZD5363 and pitavastatin combination treatment on day 4. **, P = 0.0021; ***, P = 0.0002; ****, P < 0.0001.

