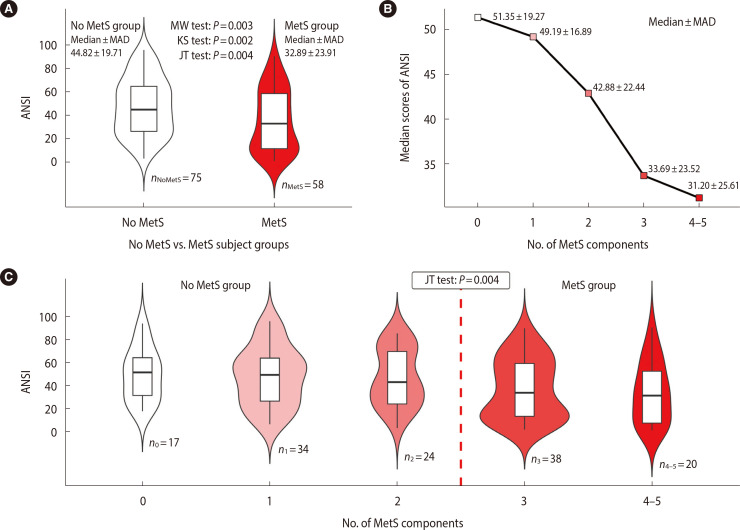
Figure 1.
Violin and line plots graphically showing the relationship between autonomic nervous system index (ANSI) and metabolic syndrome. (A) Violin plots (with the box plots inside) of the ANSI distribution in the no metabolic syndrome (MetS) and MetS groups. The displayed numbers are the group counts (lower part), median±median absolute deviation (MAD) of ANSI computed within the groups (top left and top right part), and P-values of the Mann-Whitney (MW), Kolmogorov-Smirnov (KS), and permutation Jonckheere-Terpstra (JT) tests (top central part). The MW and KS tests have the meaning described below Table 1 but were here applied as one-tailed tests. For the MW test, the null hypothesis H0:θ≥0 was tested against the alternative: H1:θ<0. For the KS test, the hypothesis H0:FnoMetS(x)≥FMetS(x) for every x was tested against H1:FnoMetS(x)<FMetS(x) for at least one x (i.e., roughly speaking, the alternative hypothesis means that the MetS population would have low ANSI scores with a higher probability than the no MetS population). For the permutation JT test, the null hypothesis H0:τnoMetS=τMetS was tested against the ordered decreasing alternative H1:τnoMetS>τMetS, where τnoMetS and τMetS are the effects of the no MetS and MetS populations, respectively, on ANSI. (B) Line plot of the median ANSI scores plotted against the number of MetS components. The displayed numbers are the median±MAD of the ANSI computed at every number of MetS components. (C) Violin plots (with the box plots inside) of the ANSI distribution within the five MetS component subgroups. The displayed numbers are the subgroup counts nc and the P-value of the permutation JT test, by which the null hypothesis H0:τ0=τ1=τ2=τ3=τ4–5 was tested against the ordered decreasing alternative H1:τ0≥τ1≥τ2≥τ3≥τ4–5 with at least a strict inequality, where τc is the effect on the ANSI of a number equal to c of the MetS components (for c=0, 1, 2, 3, and 4–5). The areas of the violins are proportional to the count of their corresponding group or subgroup.

