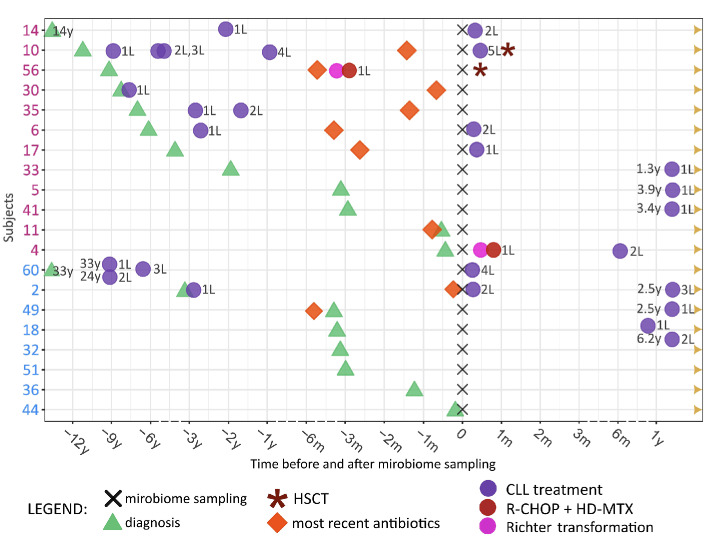
Figure 2.
Swimmer plot illustrating the clinical course of disease of patients with chronic lymphocytic leukemia. Patients from clusters 1 and 2 in Figure 1 are included in the swimmer plot. All included patients were alive at the end of the follow-up period (September 15, 2022). The time points of diagnosis of chronic lymphocytic leukemia, treatment for the leukemia, antimicrobial treatment, and microbiome sampling are shown in the swimmer plot. X-axis: time before and after microbiome sampling: non-continuous parts of the time scale are represented by dashed lines. Y-axis: each subject’s number, colored according to the clusters they belonged to (purple: cluster 1, low diversity; blue: cluster 2, high diversity). L: line of treatment; m: months; y: years; HSCT: hematopoietic stem cell transplantation; CLL: chronic lymphocytic leukemia; R-CHOP + HD-MTX: rituximab, cyclophosphamide, doxorubicin, vincristine and prednisone plus high-dose methotrexate.

