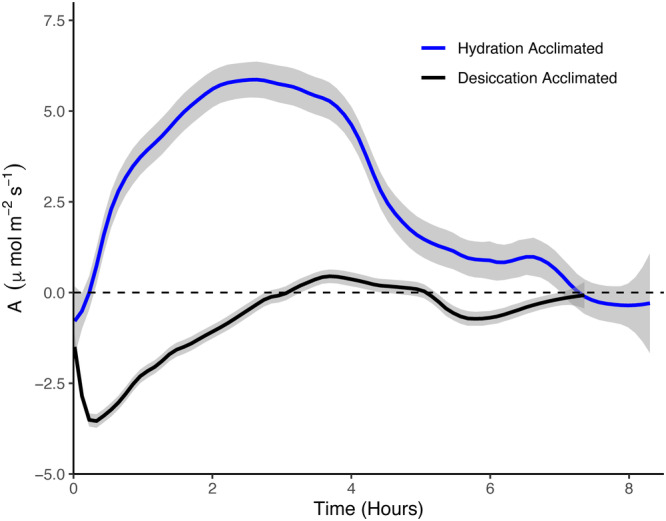
Figure 4.

Comparison of net C balance curves measured on populations of Syntrichia caninervis subjected to desiccation‐acclimated (field‐collected, black; lower curve) or hydration‐acclimated (lab‐cultivated, blue; upper curve) conditions. In each curve, C flux (A, μmol·m−2·s−1) is shown as a function of time since hydration; values above zero on the y‐axis represent net C fluxes to the moss, and values below zero represent C fluxes to the air. Lines are local regressions with a span of 0.1 (this value best illustrates biologically relevant curve microdynamics) with n = 5 for each treatment. Gray‐shaded bounds represent 95% confidence intervals for each local regression line.
