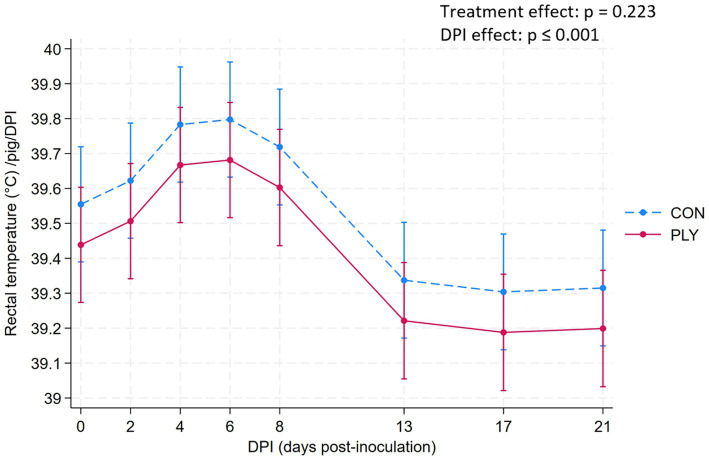
Figure 5.
Rectal temperature (°C) in Play (PLY, solid line) and Control (CON, dashed line) treatments per pig (n = 28) on 0, 2, 4, 8, 13, 17, and 21 days post-inoculation (DPI). Data are presented as predicted means and 95% confidence intervals. ‘X’ between two variables signifies an interaction effect. No interaction effect of treatment with time variable is present, thus, the presented values are summarised over all values (both treatments show the same DPI to DPI change). The pairwise comparisons listed below have p-values less than or equal to the significant threshold (ST), adjusted using the Bonferroni correction to control the analysis-wise error. The type and number of comparisons are in italics and parentheses, respectively. DPI effect—across consecutive days, baseline DPI0 vs. 21. ST (8): p = 0.006. DPI8 vs. 13, DPI0 vs. 21.

