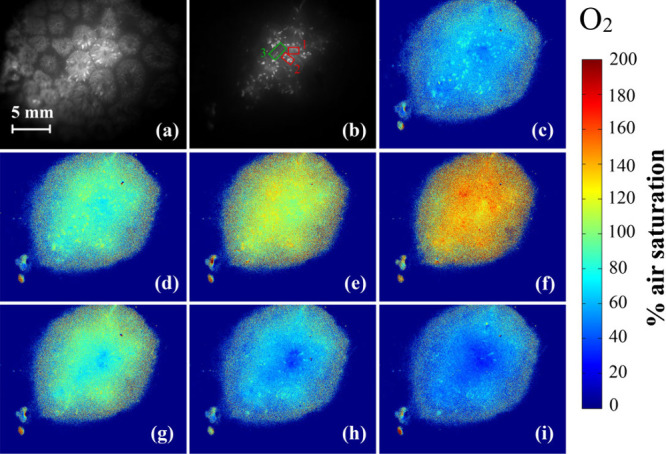
Figure 4.

Subsurface O2 dynamics during light–dark shifts in the coral Goniastrea sp. (a) Structure of the coral revealed by an intensity image; (b) phosphorescence intensity image (1 μs delay) and the 3 regions of interest; (c–i), pseudocolor images of the O2 distribution during light activation with a photon irradiance (617 nm) of 110–120 μmol photons·m–2·s–1 after 0, 65, 135, and 260 s for (c), (d), (e), and (f), respectively, and during the subsequent dark phase after 50, 70, and 130 s for (g), (h), and (i), respectively.
