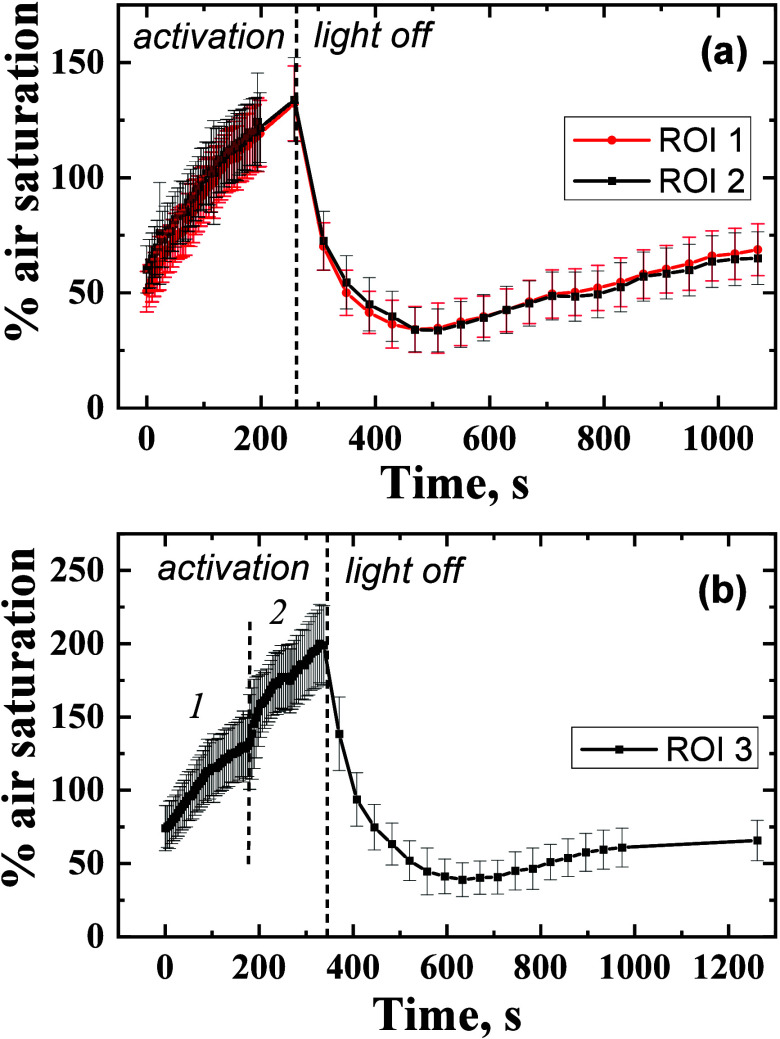
Figure 5.
Subsurface O2 dynamics in specific tissue ROI’s (outlined in Figure 4b) of the coral Goniastrea sp. light–dark shifts. In panel (a) the photon irradiance during activation was 110–120 μmol photons·m–2·s–1, while in panel (b) the respective values were 110–120 μmol photons·m–2·s–1 (period 1) and 220–240 μmol photons·m–2·s–1 (period 2). Symbols with error bars indicate means ± standard deviation within the ROI.

