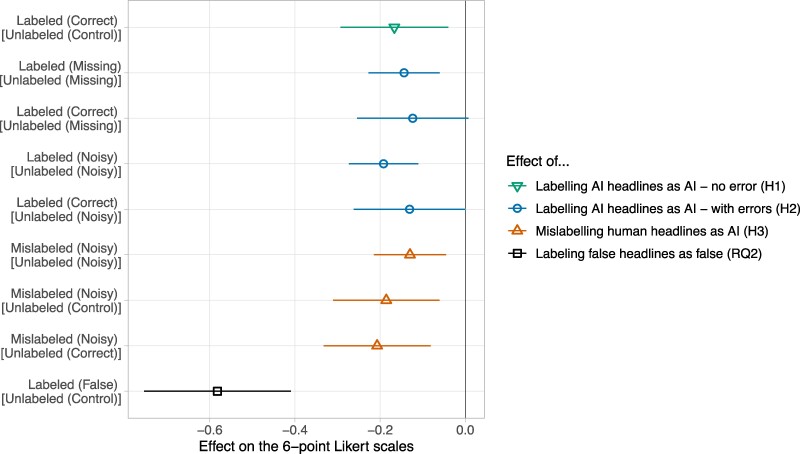
Fig. 2.
An overview of treatment effects. The first estimate (the inverted triangle) represents the effect of labeling AI headlines when all headlines are perfectly labeled (H1). The next four estimates (the circles) represent the effect of labeling AI headlines when not all headlines are perfectly labeled (H2). The next three estimates (the triangles) represent the effect of mislabeling human headlines (H3). The last estimate (the square) represents the effect of labeling false headlines as false (RQ2).

