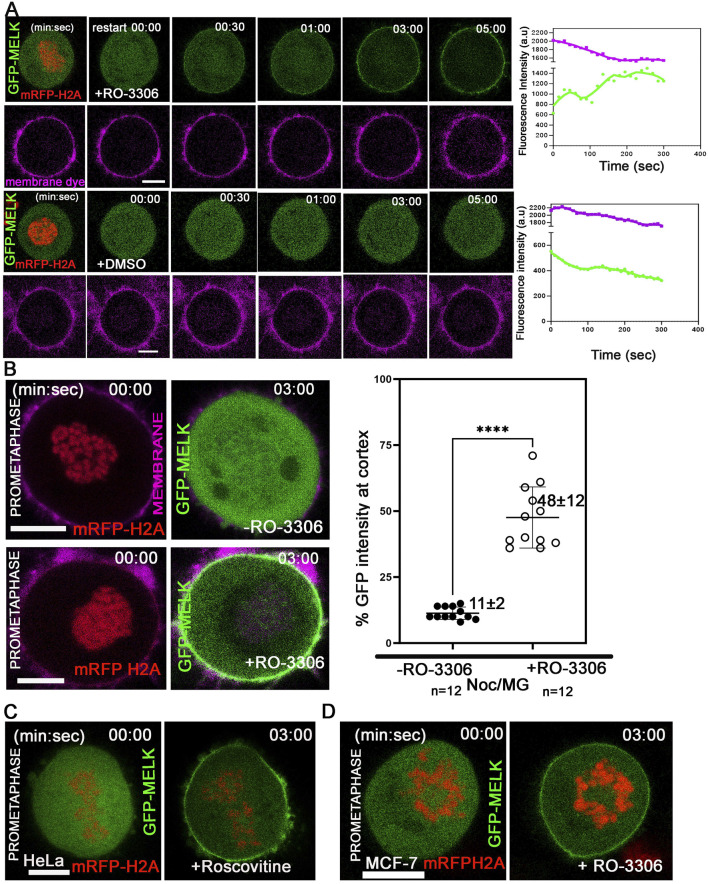
FIGURE 2.
Reduced CDK1 activity is required for MELK cortex localization. (A) HeLa cells expressing mRFP-histone H2A were arrested in prometaphase with nocodazole and MG132 and stained with membrane dye (CellBrite Steady 650) before imaging. RO-3306 was added and live cell imaging immediately started with a time interval of 10 s. GFP-MELK and mRFP-H2A (1st row) and the membrane dye (2nd row) are shown in green, red and magenta, respectively. The intensities of cortical GFP and membrane dye were quantified with respect to time. The time stamps indicate minutes: seconds (min: sec). The bottom two rows are mock experiments with DMSO added. (B) The intensities of GFP signals in the whole cell or at cell cortex were measured before or 3 min after addition of RO-3306 in HeLa cells expressing mRFP-histone H2A, transfected with GFP-MELK and arrested in prometaphase by nocodazole and MG132 treatment (Noc/MG). Representative images are shown on the left, and the quantitation shown as a scatter plot on the right. Scale bar is 10 µm. **** indicated P < 0.0001 in Student’s t-test. (C) HeLa cells transfected with GFP-MELK were treated similarly as in (A) but exposed to Roscovitine (5 µM) for CDK1 inhibition. A single plane representative image is shown before and after treatment. (D) MCF-7 cells expressing mRFP-histone H2A were treated similarly as in (A) with RO-3306. A single plane representative image is shown before and after treatment. Scale bar = 10 µm.

