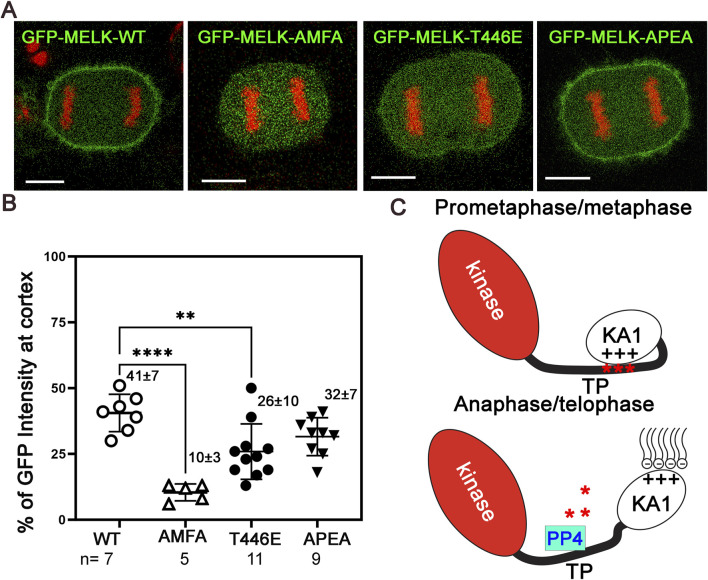
FIGURE 5.
PP4 helps determine the timing of MELK cortex localization. (A) Selected images of anaphase HeLa cells transfected with GFP-MELK-wild type (WT), or its FPEP to APEA mutant, or FMFP to AMFA mutant, or T446E mutant to show differences in the cortex localization of MELK. These cells also stably express mRFP-histone H2A (shown in red). (B) Scatter plot showing the % GFP fluorescence intensity at the cortex in anaphase cells transfected with different GFP-MELK constructs. The last anaphase images with no detectable cleavage furrow signs were used for quantification. ** denotes P < 0.01 and **** indicated P < 0.0001. (C) A model to explain the spatiotemporal control of MELK during mitosis. See text for details.

