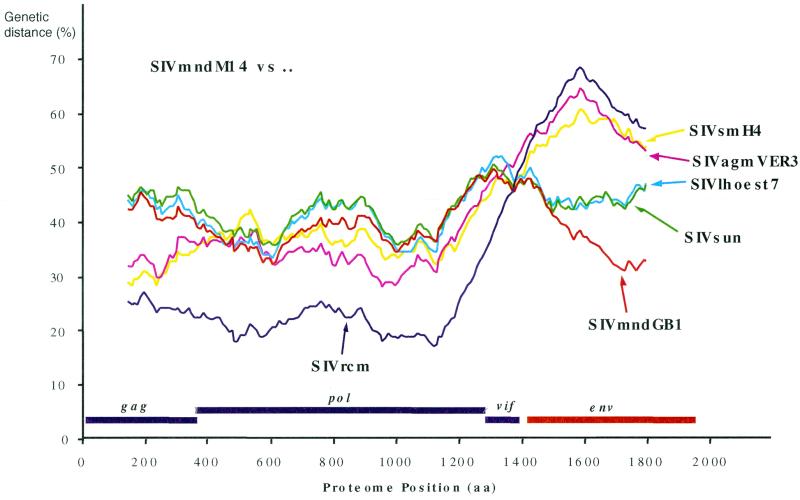
FIG. 3.
Diversity plot comparing SIVmndM14 (the SIVmnd-2 representative) to SIVmndGB1 (the SIVmnd-1 representative), SIVrcm, SIVsun, SIVlhoest, SIVsm, and SIVagm. For each pairwise comparison, protein sequence difference was plotted against the midpoint of a 300-amino-acid window that was incremented by 10 amino acids across a proteome alignment including the genes gag, pol, vif, and env. The positions of these genes are shown beneath the plot.

