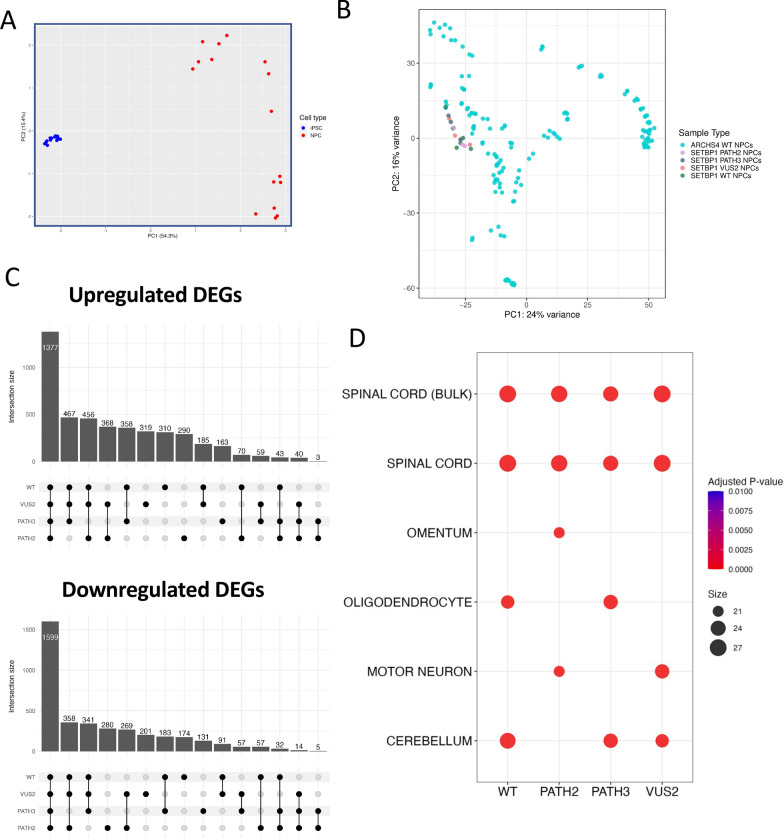
Fig. 3.
Neural identity of differentiated SETBP1 iPSC clones. A PCA plot demonstrating clear separation between iPSC and NPC samples based on gene expression. B PCA plot comparing SETBP1 experimentally derived NPCs with wild-type NPCs from the ARCHS4 database. C Numbers of DEGs up and downregulated in NPCs defined by SETBP1 genotype. D Analysis of top 50 significant upregulated genes in NPCs compared to iPSCs using Enrichr demonstrated enrichment of neural tissue gene sets in the ARCHS4 tissue database

