
Extended Data Fig. 6 |. Spatial analysis of epithelial cells in ductal and lobular structures.
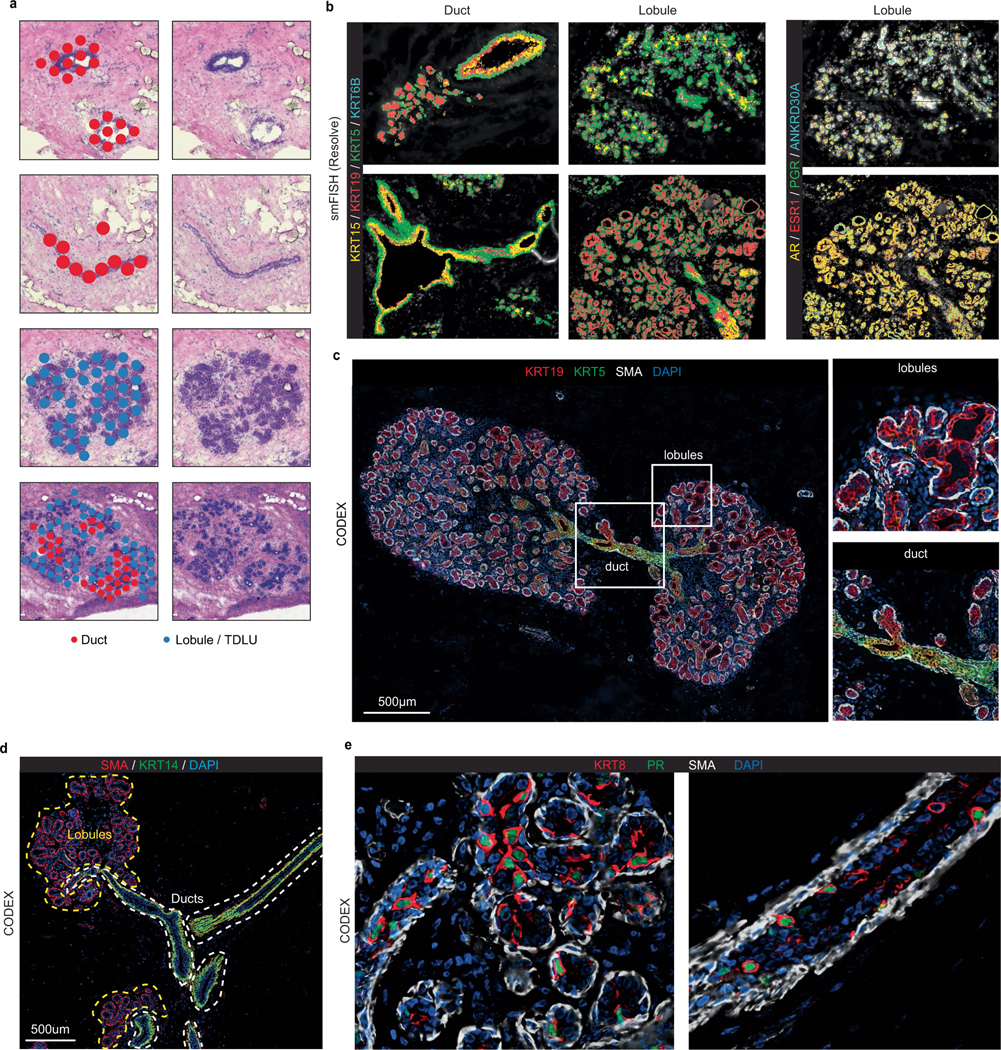
a, Spatial transcriptomic analysis showing clusters labelled as duct or lobule/TDLU from 3 breast tissues (P10, P35 and P47). b, smFISH (Resolve) data (P46-S1 and P46-S4) showing a subset of Keratin markers (left) and hormone receptor genes (right) and their localization to different breast tissue regions annotated as either duct or lobule/TDLU. c, CODEX data from P131 showing KRT5 in ducts and KRT19 in lobules/TDLU regions, with enlarged panels of the right. d, CODEX analysis from P130 of ductal and lobular/TDLU regions, showing differences for KRT14 levels in ducts and lobules. e, CODEX data from P131 showing protein levels of KRT8 and progesterone receptor (PR) in epithelial cells in the ducts and lobular/TDLU regions.