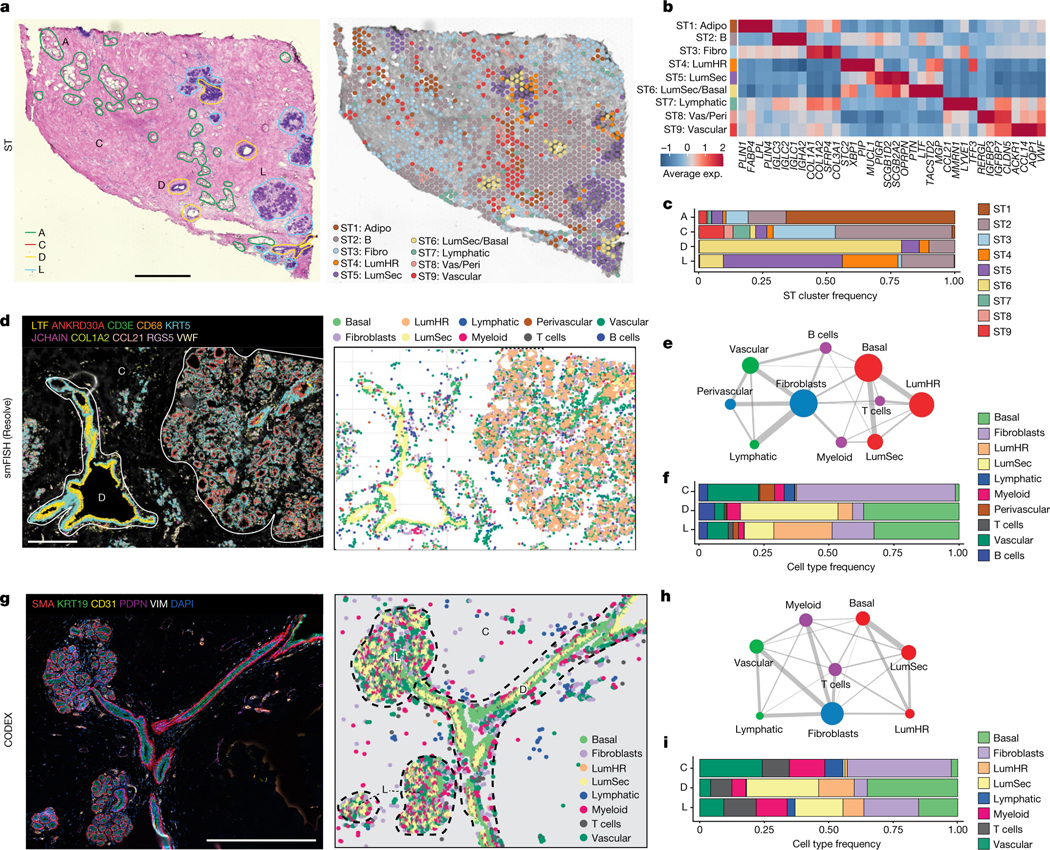
Fig. 2 |. Spatial analysis of major breast cell types.

a, ST experiment from patient P35 showing the H&E image with histopathological regions annotated (left) and clustering results (right). A, adipose tissue; C, connective tissue; D, ductal tissue; L, lobule. b, Consensus heat map of the top four marker genes in each ST cluster from ten integrated tissue samples. Exp., expression. c, The frequencies of the ST clusters from ten tissue samples across the four topographic tissue regions. d, smFISH experiments (Resolve) using a custom 100-gene panel, showing a subset of 10 genes that mark different cell types in sample 1 of P46 (P46-S1) (left) and cell segmentation using combinations of markers to identify cell types, with topographic areas annotated (right). e, Spatial colocalization graph of the cell types in smFISH (Resolve) data from 12 tissue samples. The node size represents the cell number and the edge width represents the probability of colocalization. f, Cell type frequencies across 3 topographic regions from 12 smFISH (Resolve) tissue samples. g, CODEX data from P130 showing ductal–lobular structure with five protein markers (left) and cell segmentation using combinations of markers to identify cell types, with topographic areas annotated (right). h, Spatial colocalization graph of the cell types in the CODEX data from eight tissue samples. The node size represents the cell number and the edge width represents the probability of colocalization. i, Cell type frequencies across three topographic regions from eight CODEX tissue samples. Scale bars, 1 mm (a) and 500 μm (d and g).
